Comparative Analysis of Horticultural Lighting Systems
In this analysis, we utilize the gold standard of lighting simulation software, Radiance, to test our patented high-performance horticultural lighting system, which is built around a unique geometric arrangement stratagem for LEDs that’s based on the centered square number integer pattern sequence A001844 against a standard 6-bar competitor system.
The results: Higher PPFD uniformity. Up to > 99% degree of uniformity (DOU) versus ≈ 80% DOU.
Why Radiance?
As we live in the era of AI, let’s let a simple Google AI Overview provide a succinct explanation…
Radiance is considered a best-in-class lighting simulation software for its scientific accuracy, physical-based realism, flexibility, and open-source nature, allowing for custom workflows and validation against real-world measurements. It is a powerful, free, and open-source engine known for producing high-quality results for daylighting and electric lighting design and energy efficiency analysis.
Here's why Radiance stands out
- Unrivaled Accuracy: Radiance uses a scientifically rigorous ray-tracing method validated against real measurements.
- Realistic Results: Photorealistic renderings and precise numeric outputs help predict visual quality and appearance.
- Strong Community & Validation: A dedicated user base and decades of peer validation.
We even wrapped Radiance in a web UI and precomputed data for all square and rectangular spaces for both our system and the 6-bar competitor system, which you can play around with here: Radiance Photonic Density Uniformity Solver
Now that we understand a little more about the tool we’ve chosen to simulate light, let’s get back to the comparative analysis.
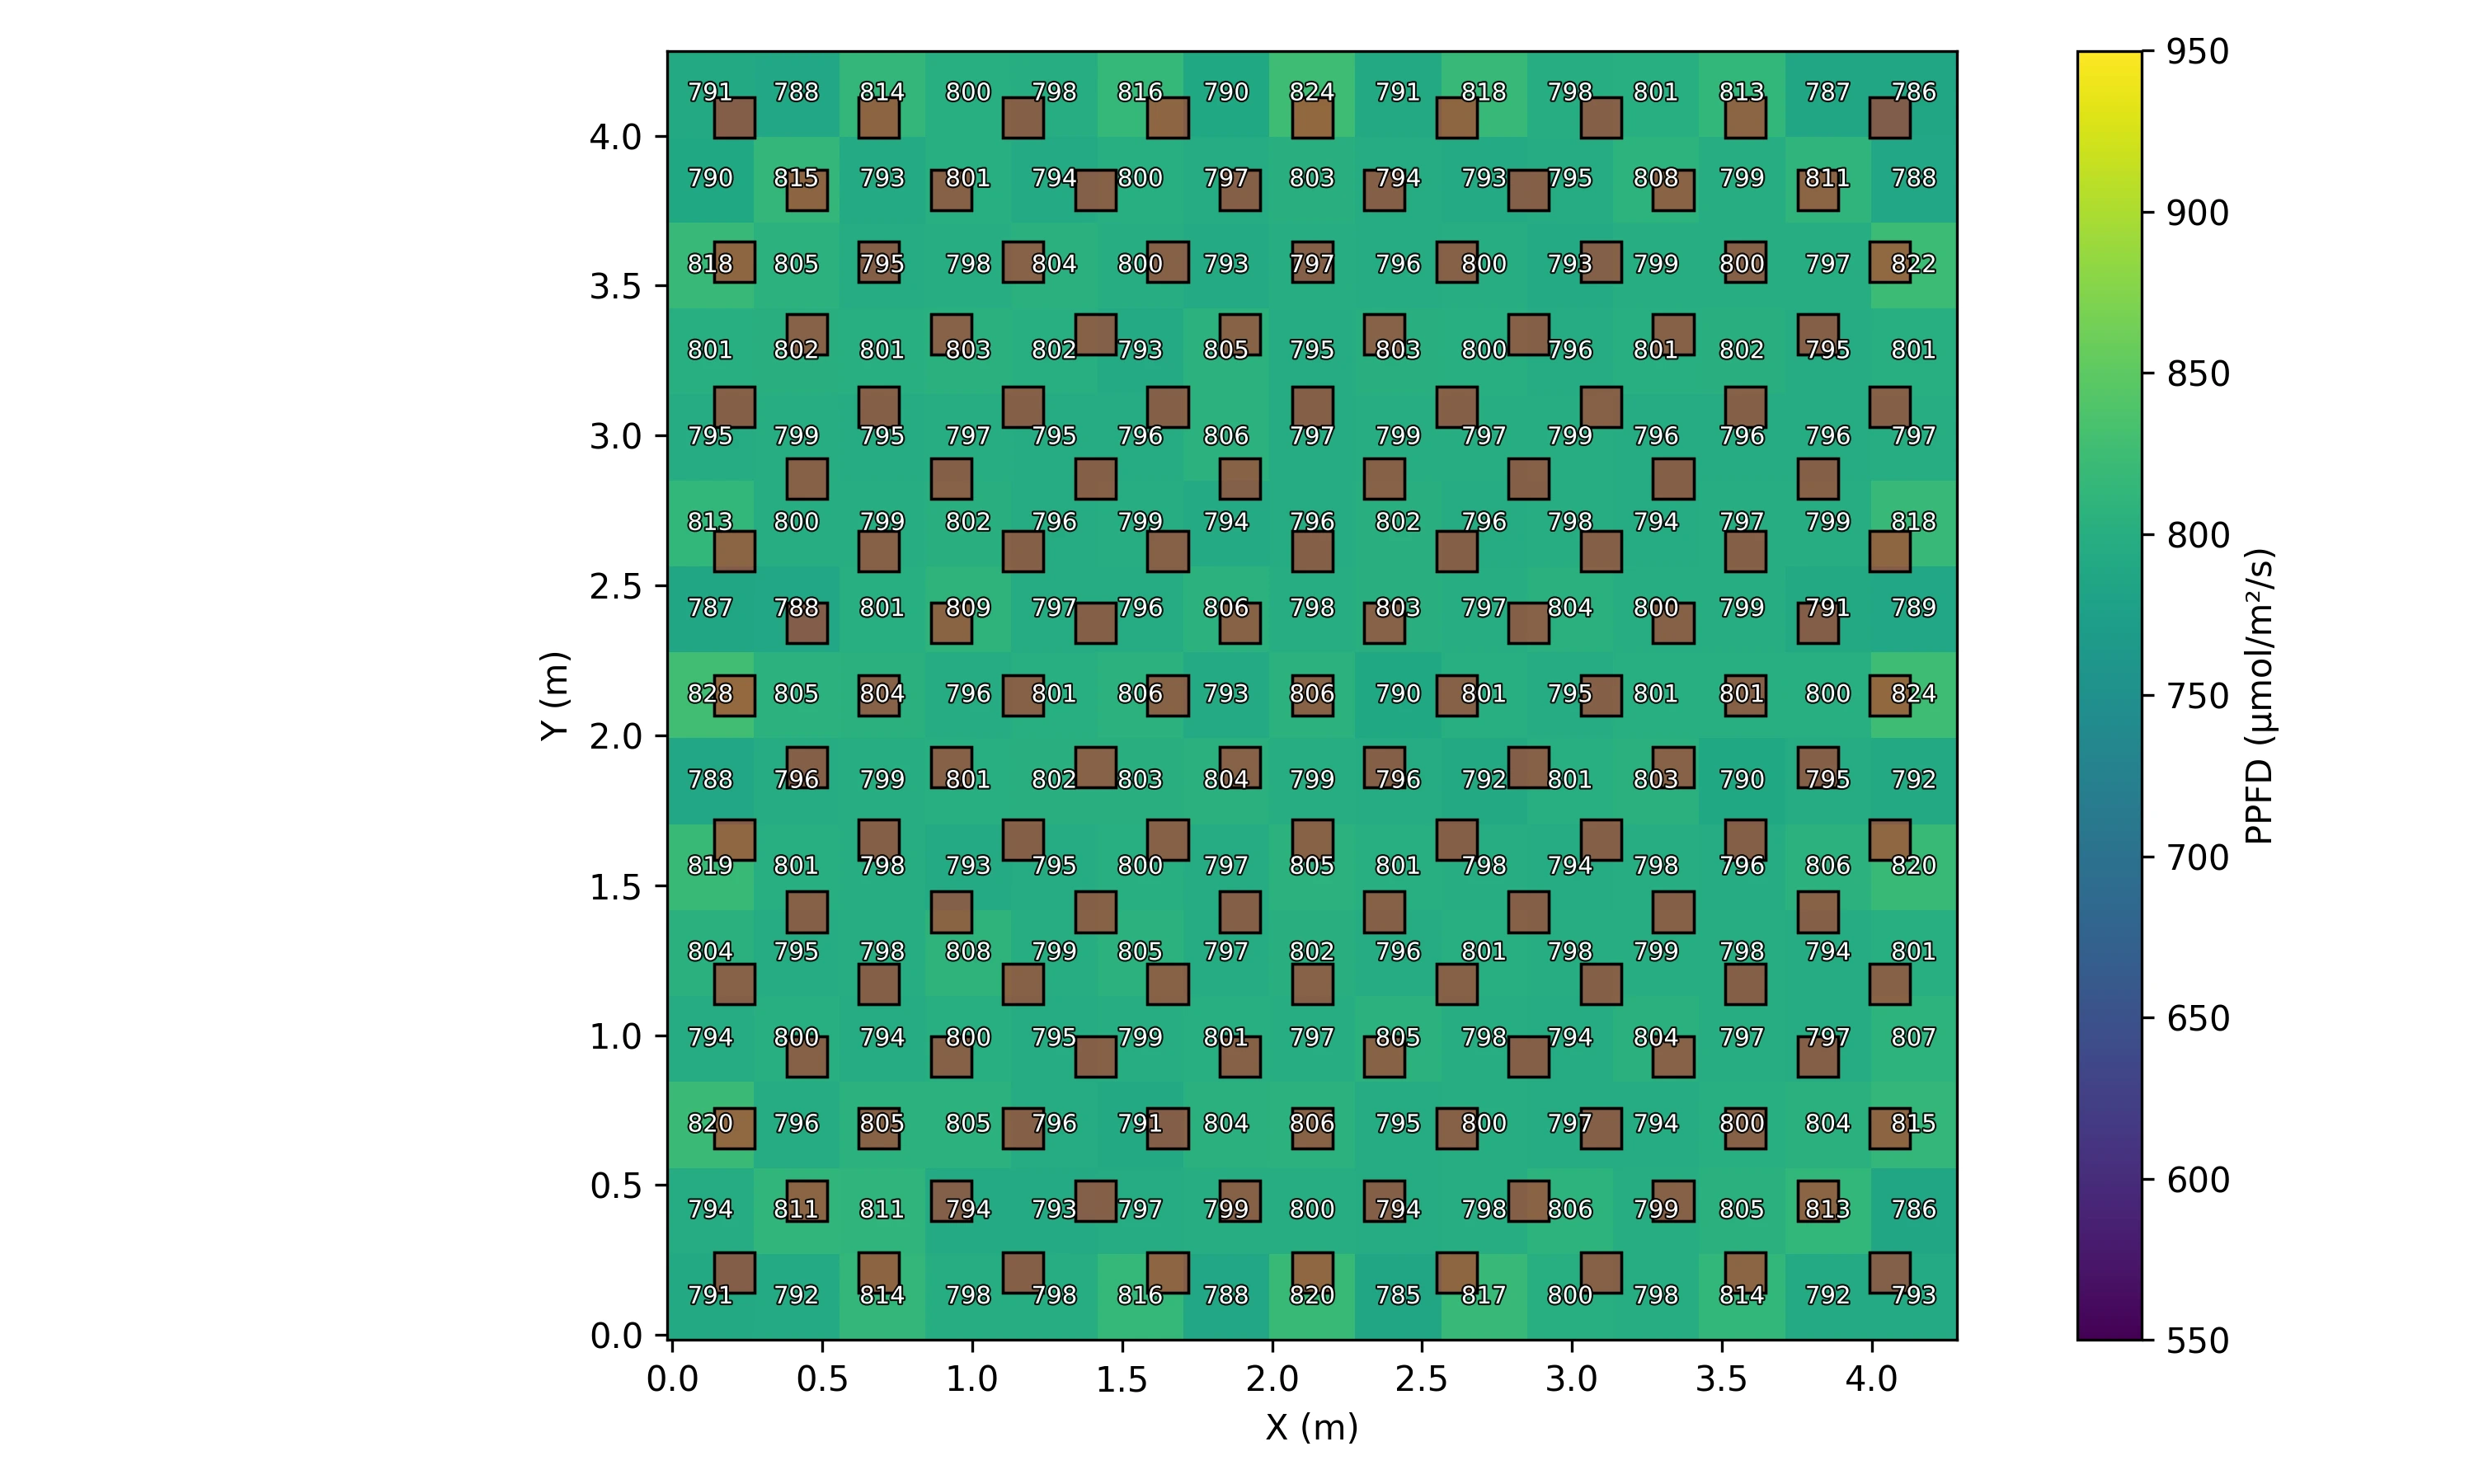
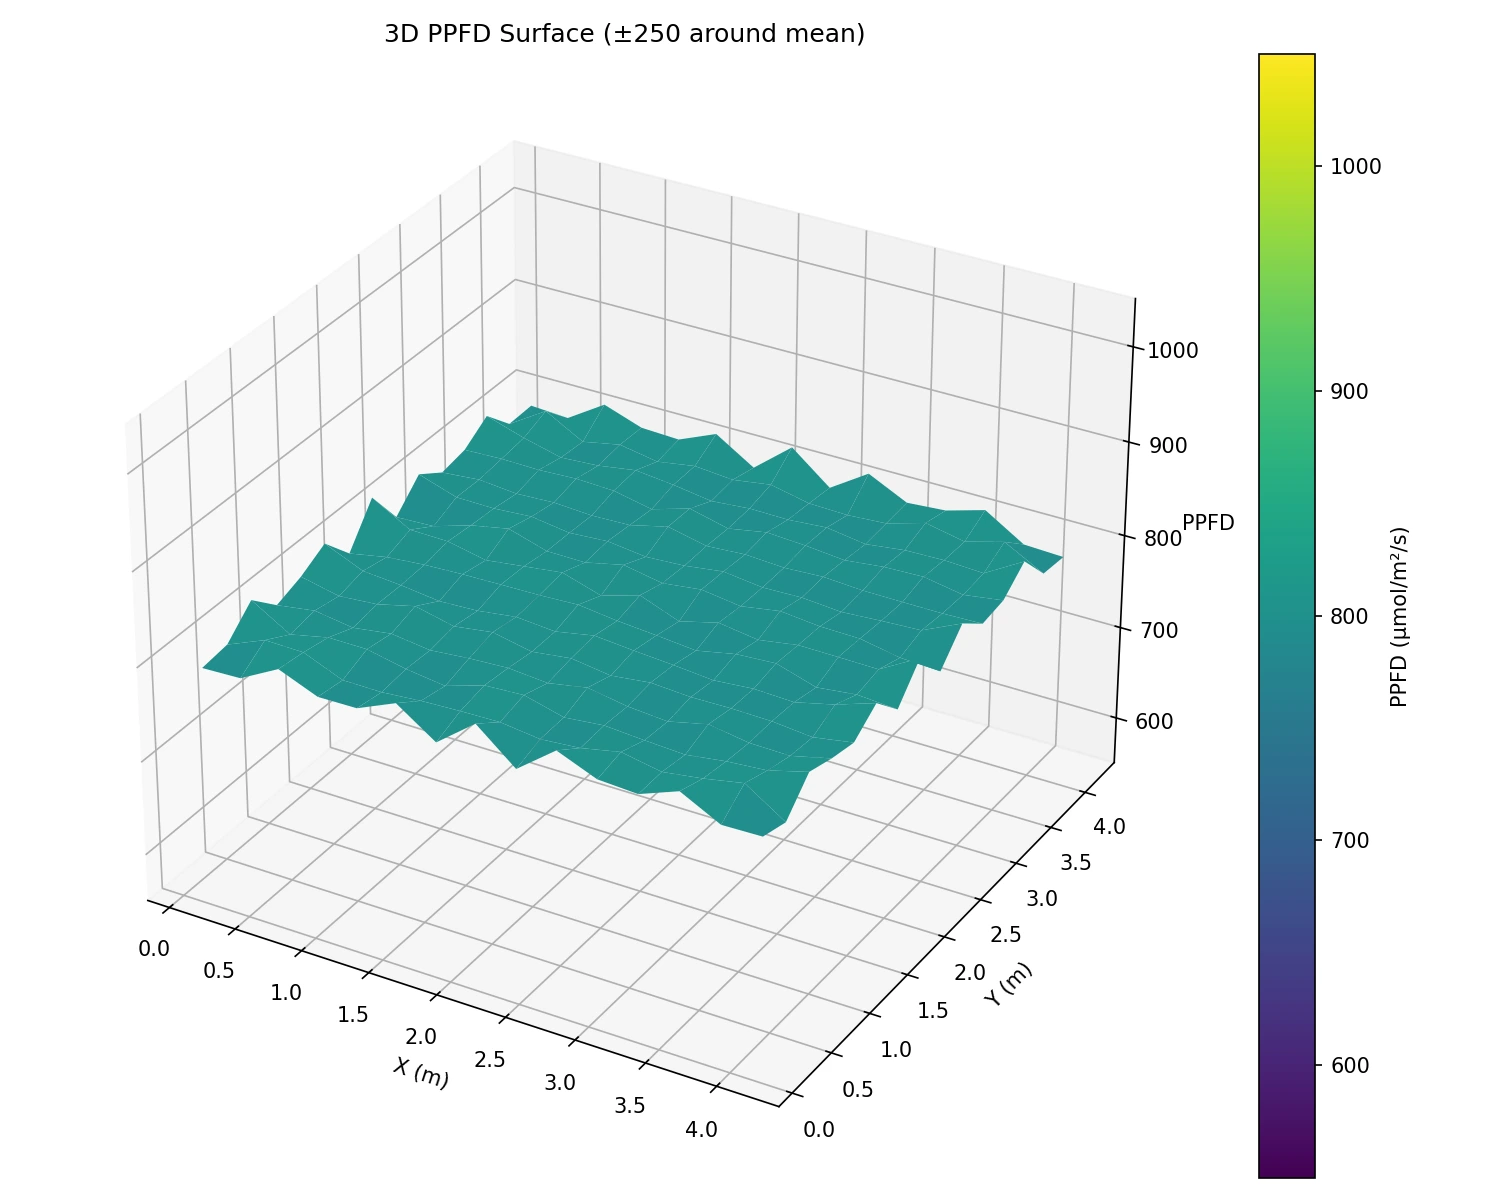
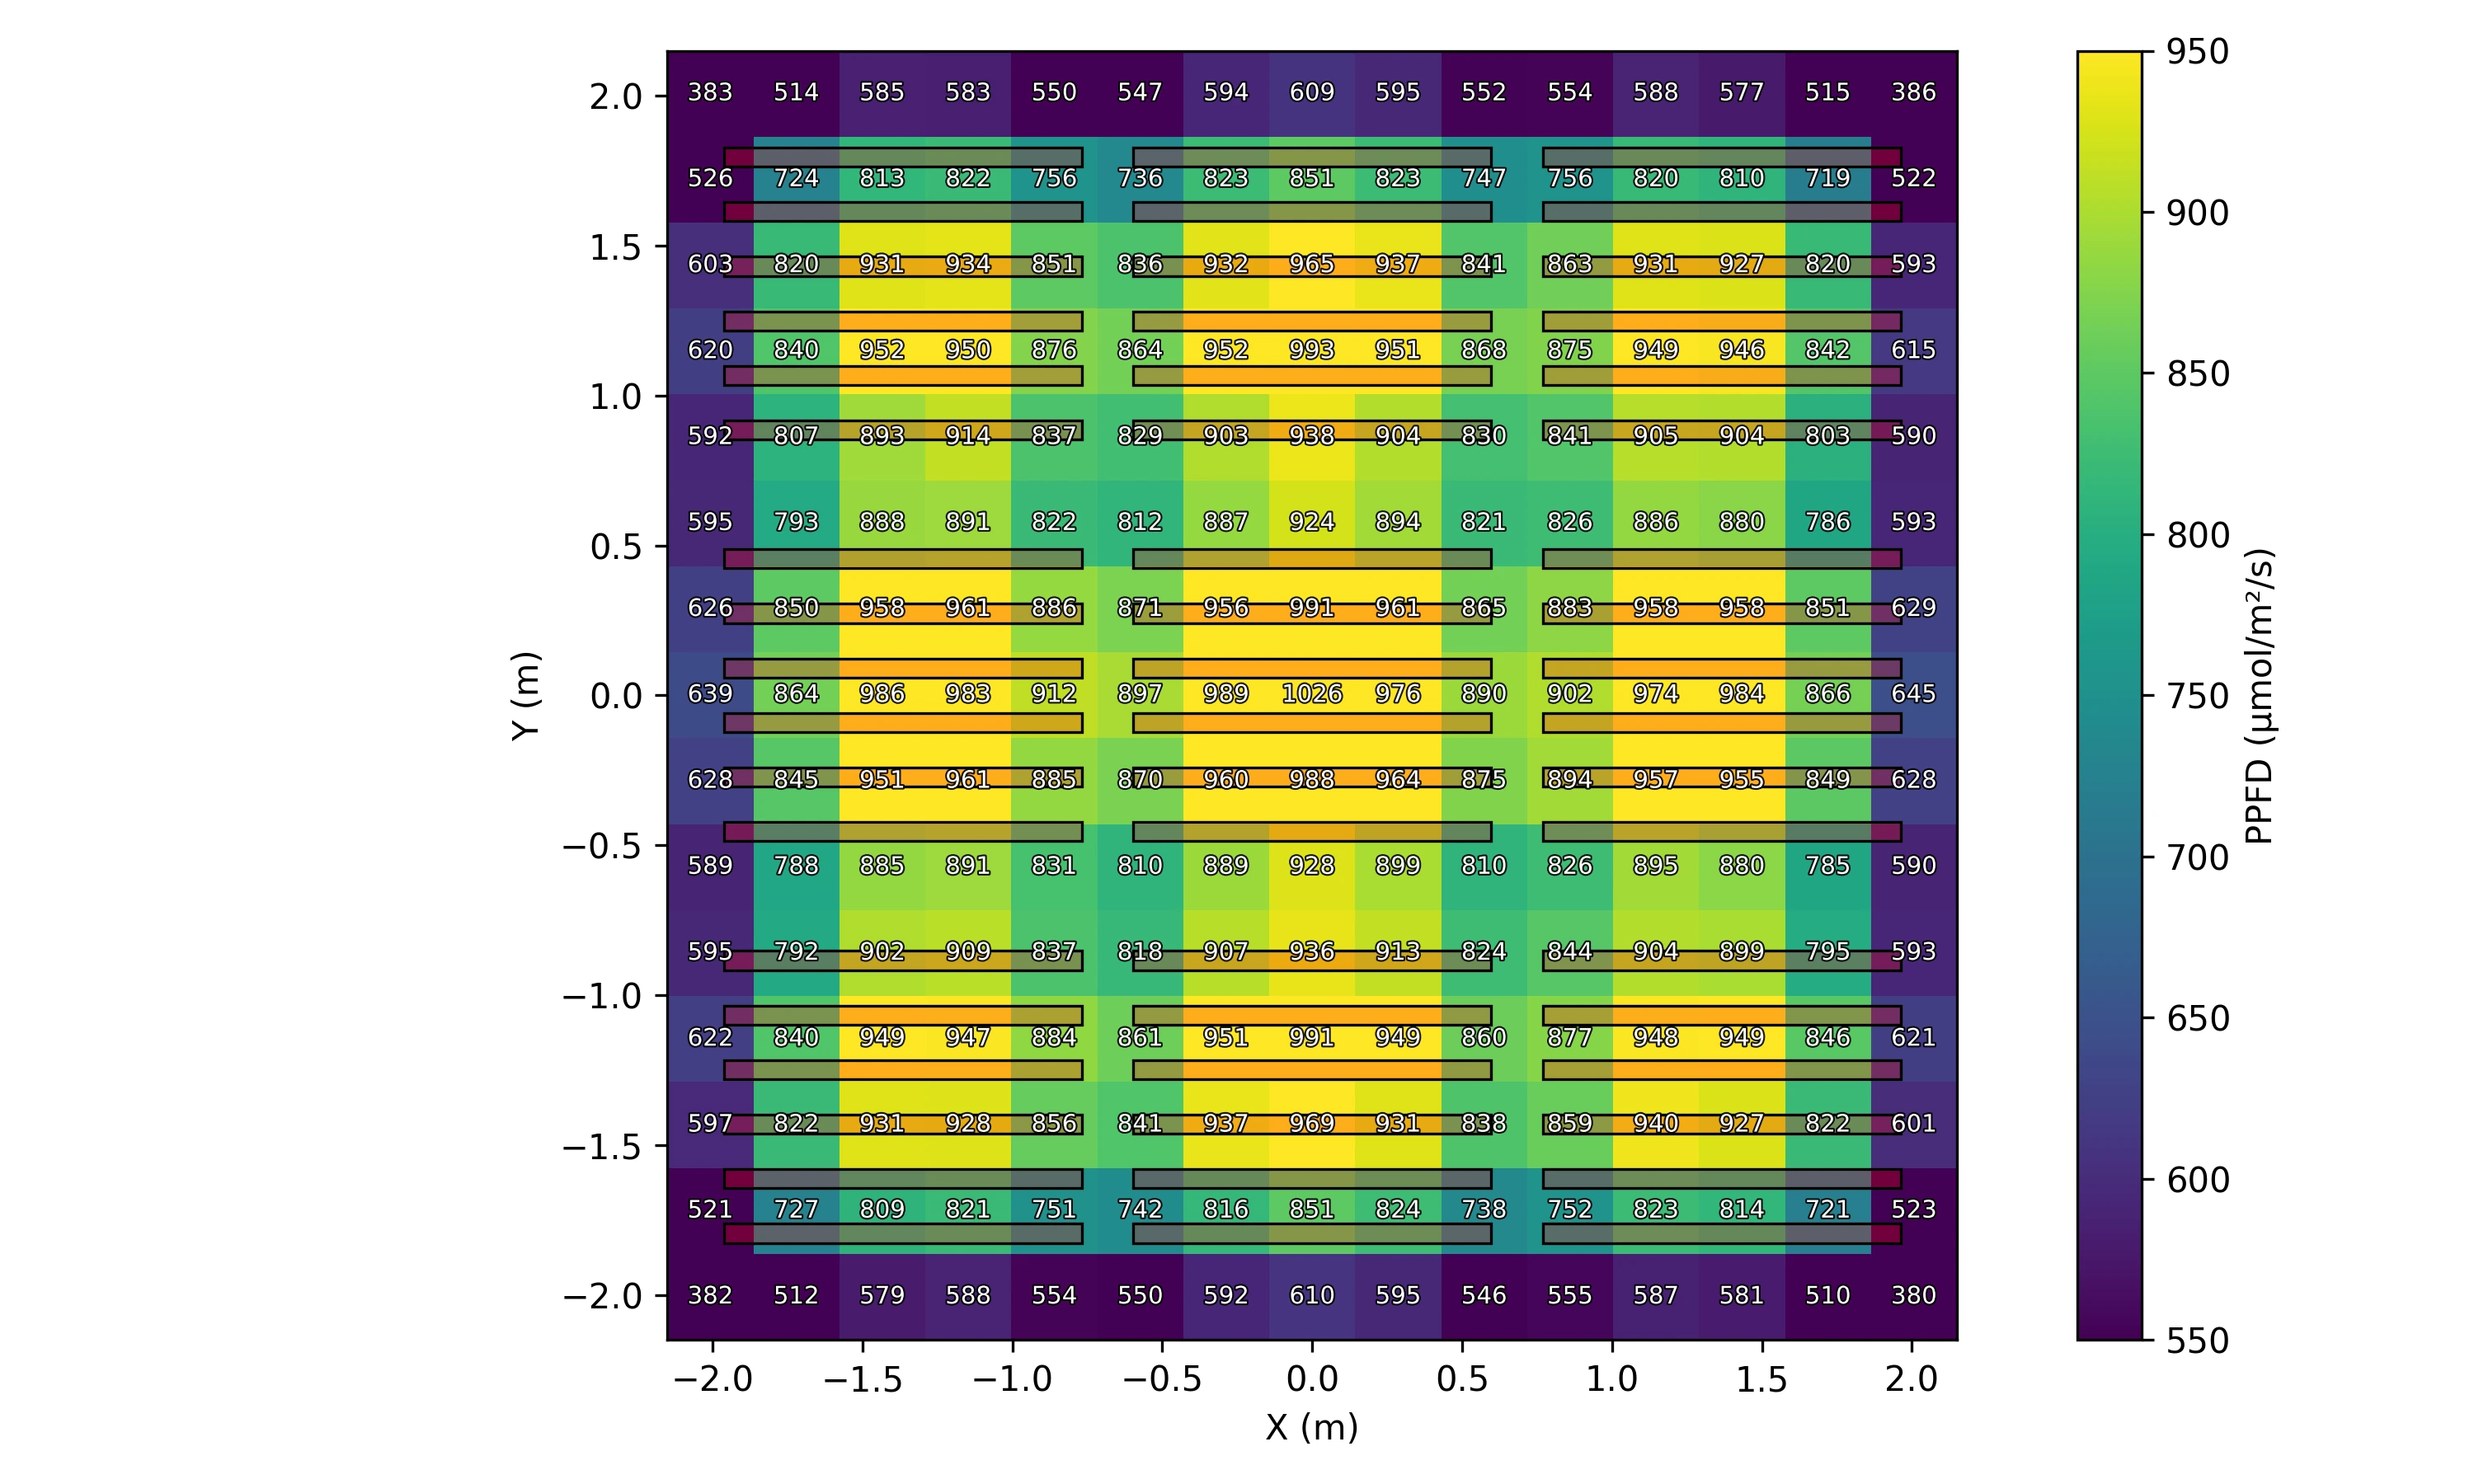
Our Patented Horticultural Lighting System Versus a Standard 6-Bar Competitor System
(14’ × 14’ Space — 800 PPFD)
Results
| Metric | Novel System | Conventional System |
|---|---|---|
| Average PPFD | 800 | 800 |
| RMSE | 7.6 | 149.5 |
| DOU (%) | 99.05 | 81.32 |
| MAD | 5.6 | 123 |
| CV (%) | 0.95 | 18.68 |
| Min/Max PPFD | 0.949 | 0.371 |
| Min/Avg PPFD | 0.982 | 0.475 |
Mathematical Representation of Metrics
Let \(P_i\) be the PPFD at the \(i\)-th point; \(n\) is the number of points (here \(n=225\)).
- Average PPFD (\(\text{PPFD}_{\text{avg}}\)):
\[ \text{PPFD}_{\text{avg}}=\frac{1}{n}\sum_{i=1}^{n} P_i \]
- Root Mean Squared Error (RMSE):
\[ \text{RMSE}=\sqrt{\frac{1}{n}\sum_{i=1}^{n}(P_i-\text{PPFD}_{\text{avg}})^2} \]
- Degree of Uniformity (DOU):
\[ \text{DOU}=100\times\Bigl(1-\frac{\text{RMSE}}{\text{PPFD}_{\text{avg}}}\Bigr) \]
- Mean Absolute Deviation (MAD):
\[ \text{MAD}=\frac{1}{n}\sum_{i=1}^{n}\lvert P_i-\text{PPFD}_{\text{avg}}\rvert \]
- Coefficient of Variation (CV):
The standard deviation is
\[ \sigma=\sqrt{\frac{1}{n}\sum_{i=1}^{n}(P_i-\text{PPFD}_{\text{avg}})^2} \]Thus
\[ \text{CV}=100\times\frac{\sigma}{\text{PPFD}_{\text{avg}}} \]
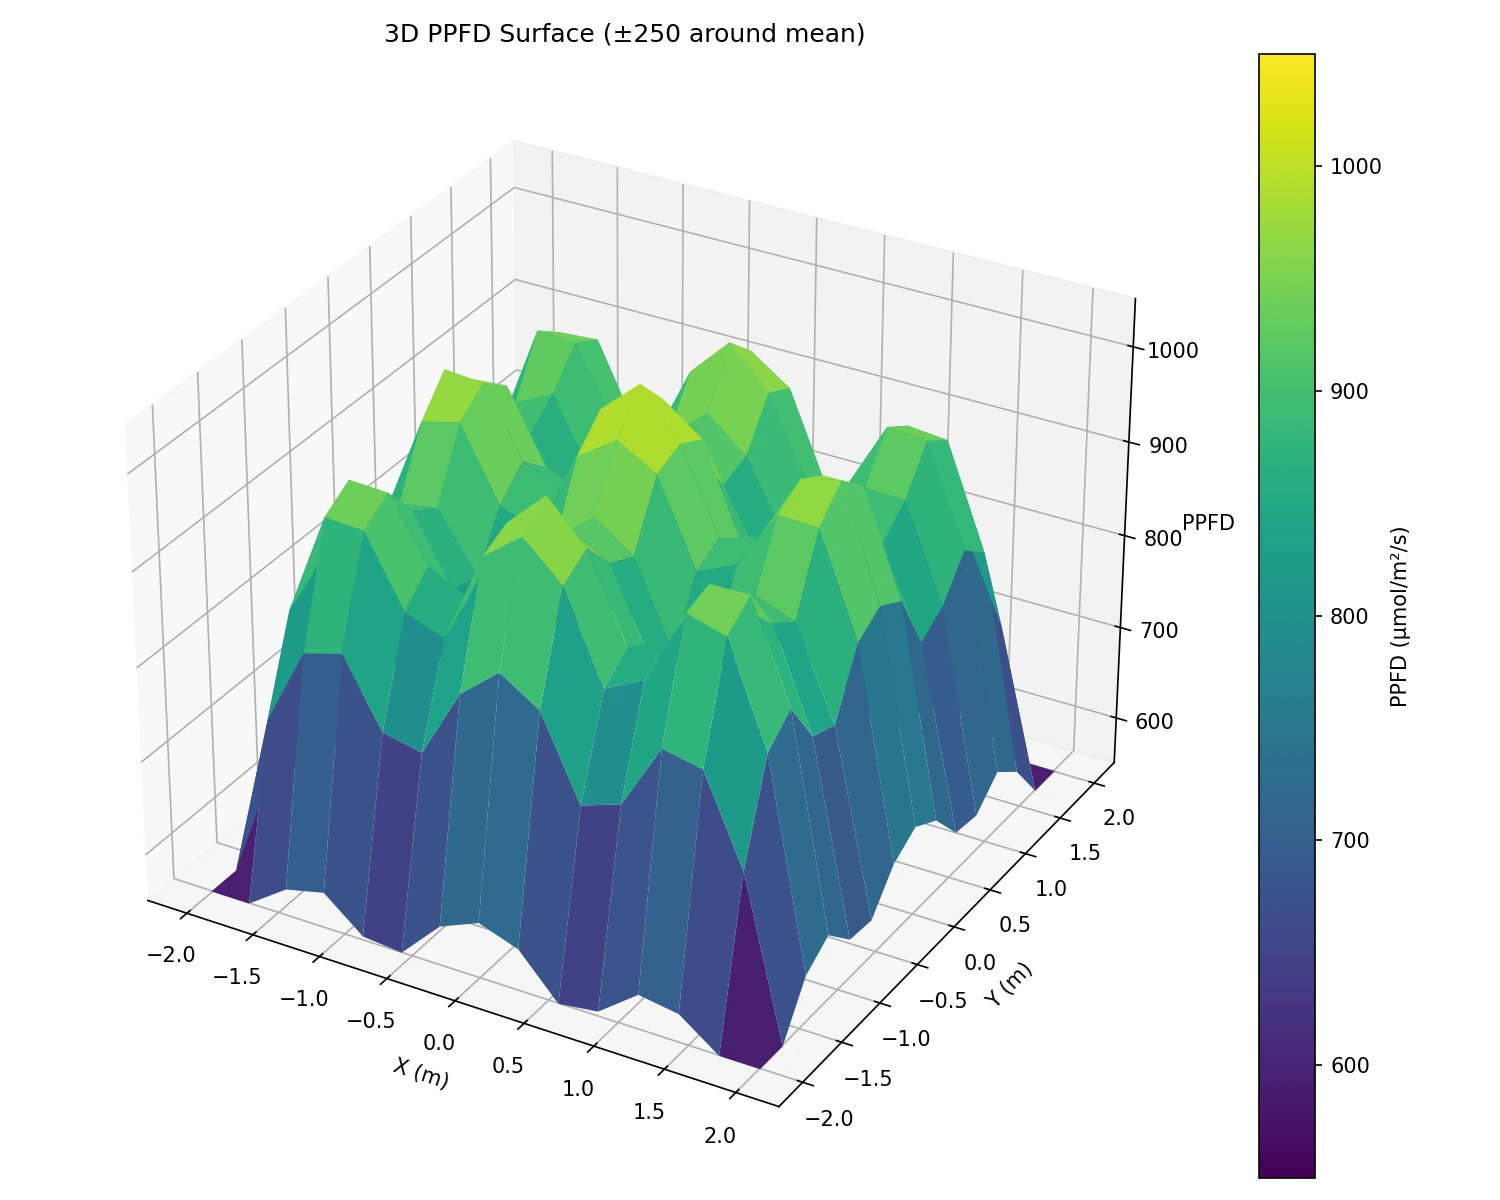
As can be seen in the results, our system achieves an unprecedented > 99% DOU and excellent Min/Avg plus Min/Max ratios (standard uniformity metrics). The competitor system not only has much lower DOU, but substantially worse Min/Avg and Min/Max, highlighting the non-uniformity inherent to conventional systems.
Now let’s try a rectangular grow space at higher PPFD…
Our Patented Horticultural Lighting System Versus a Standard 6-Bar Competitor System
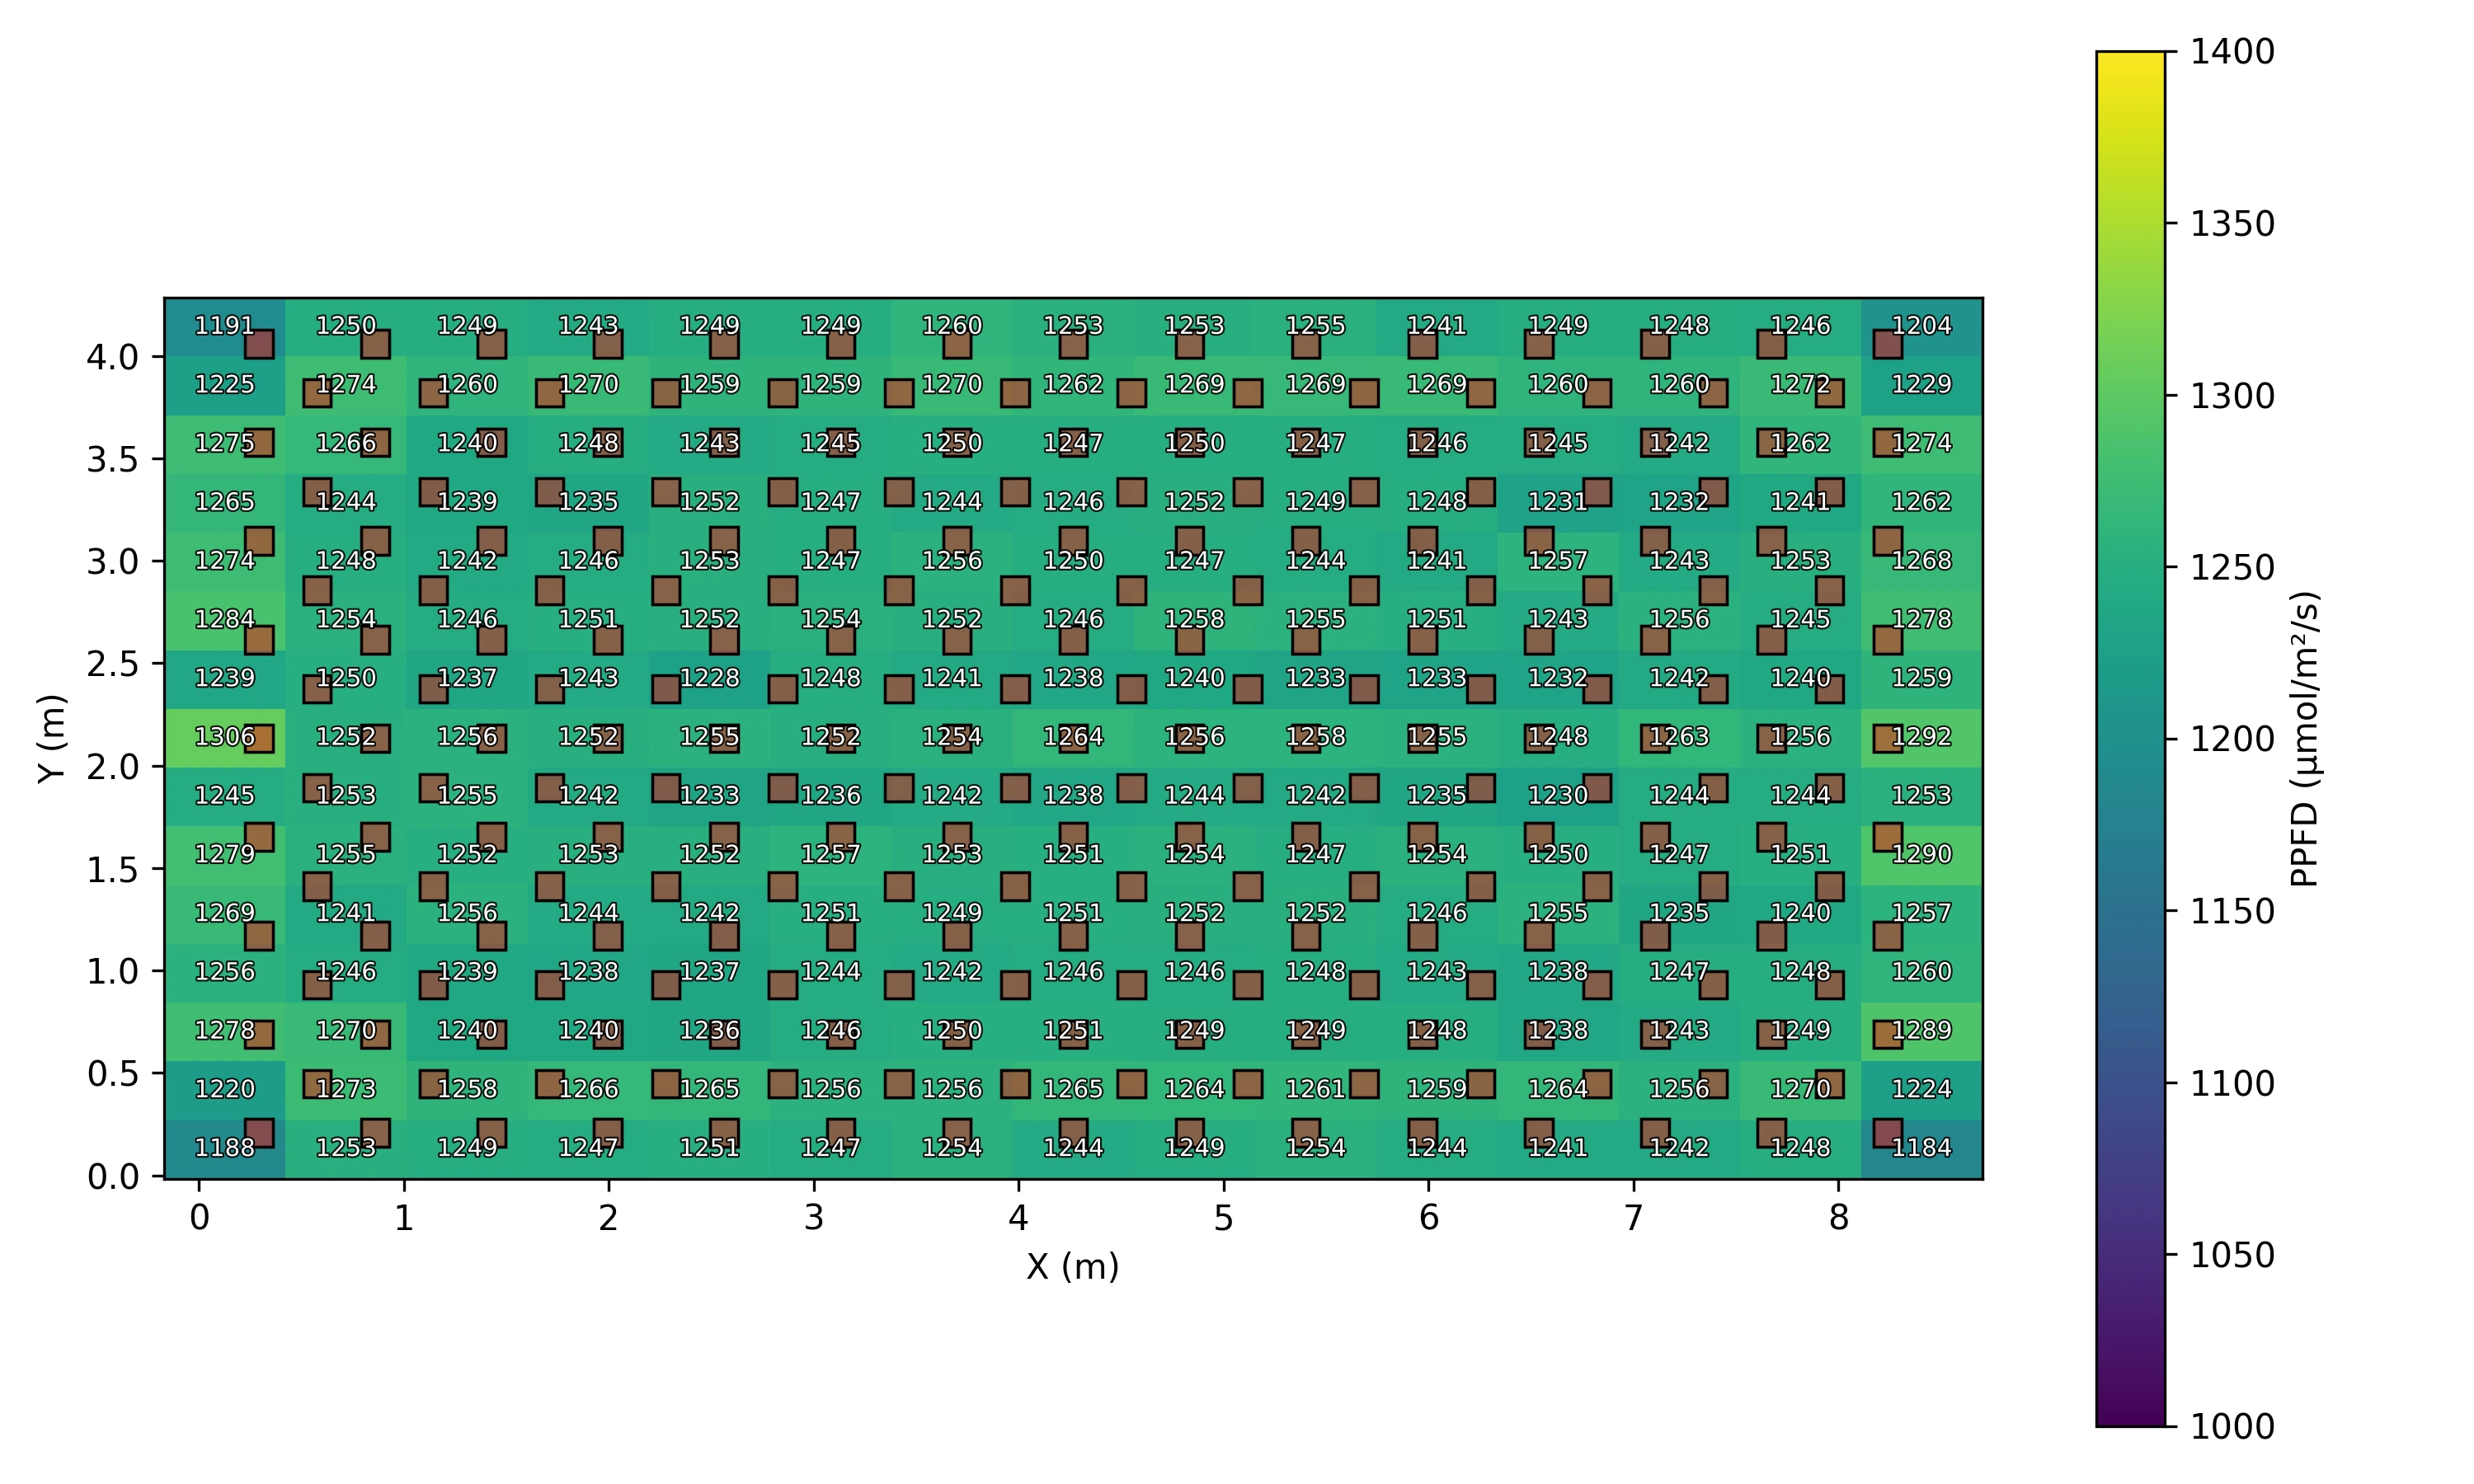
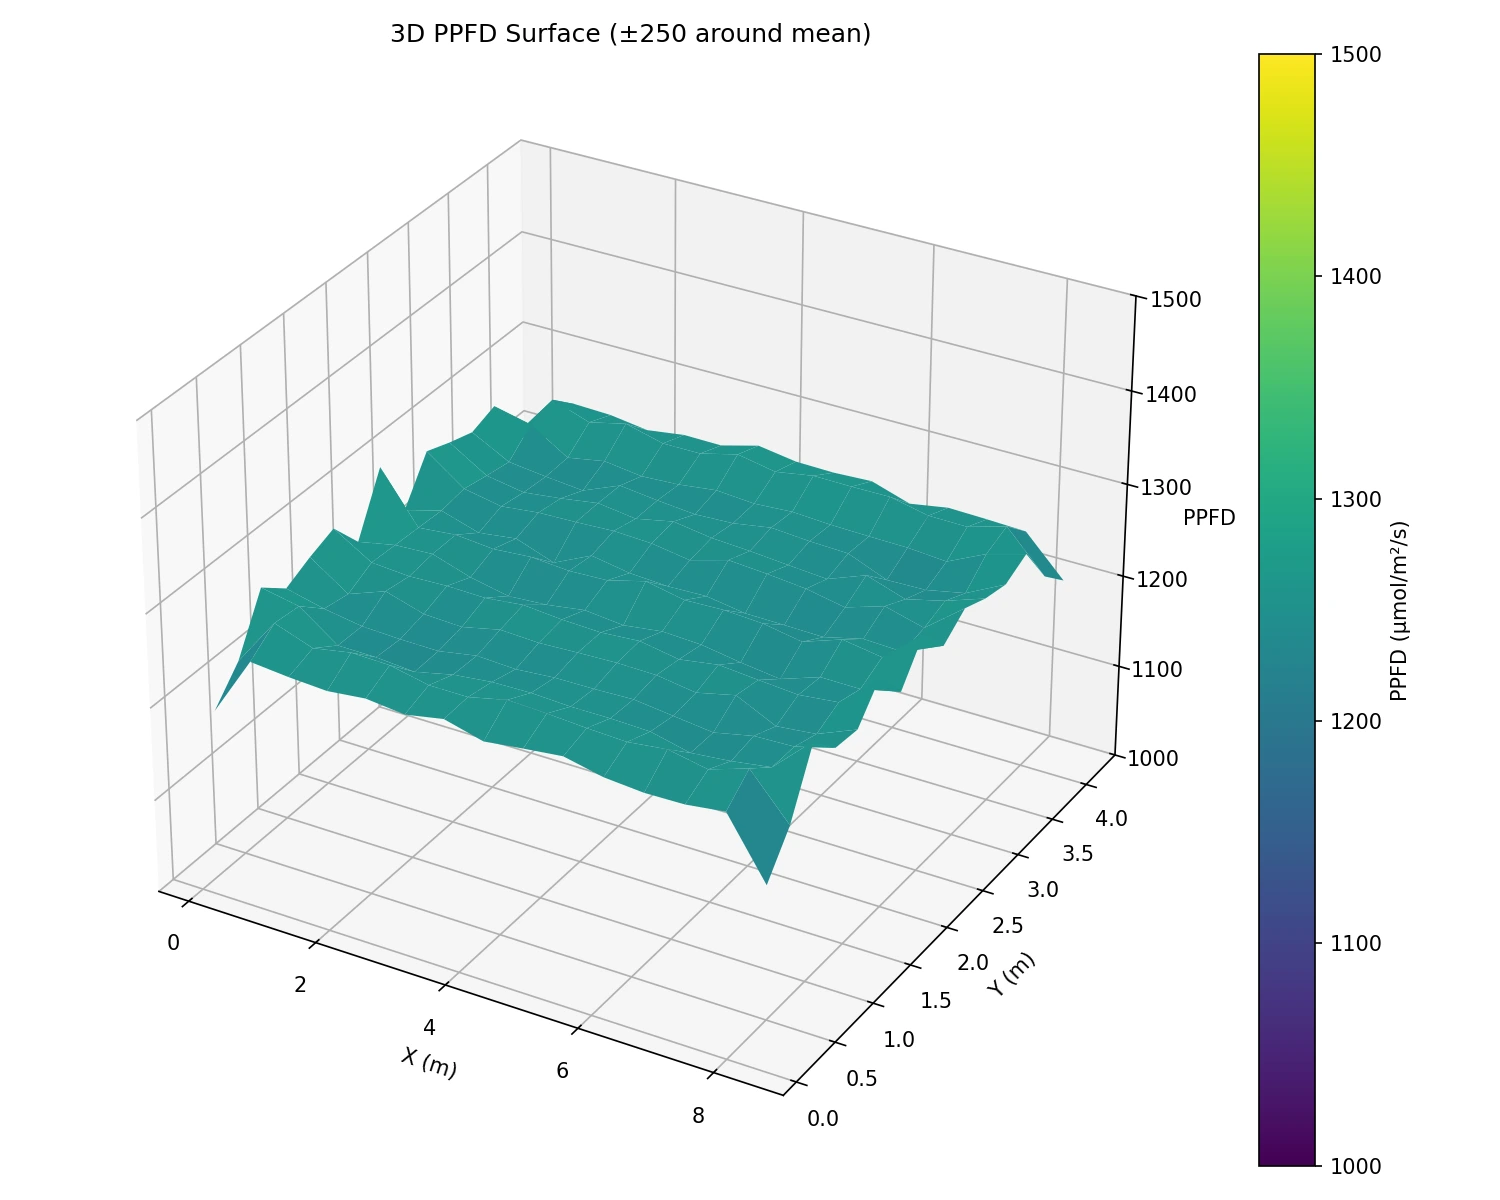
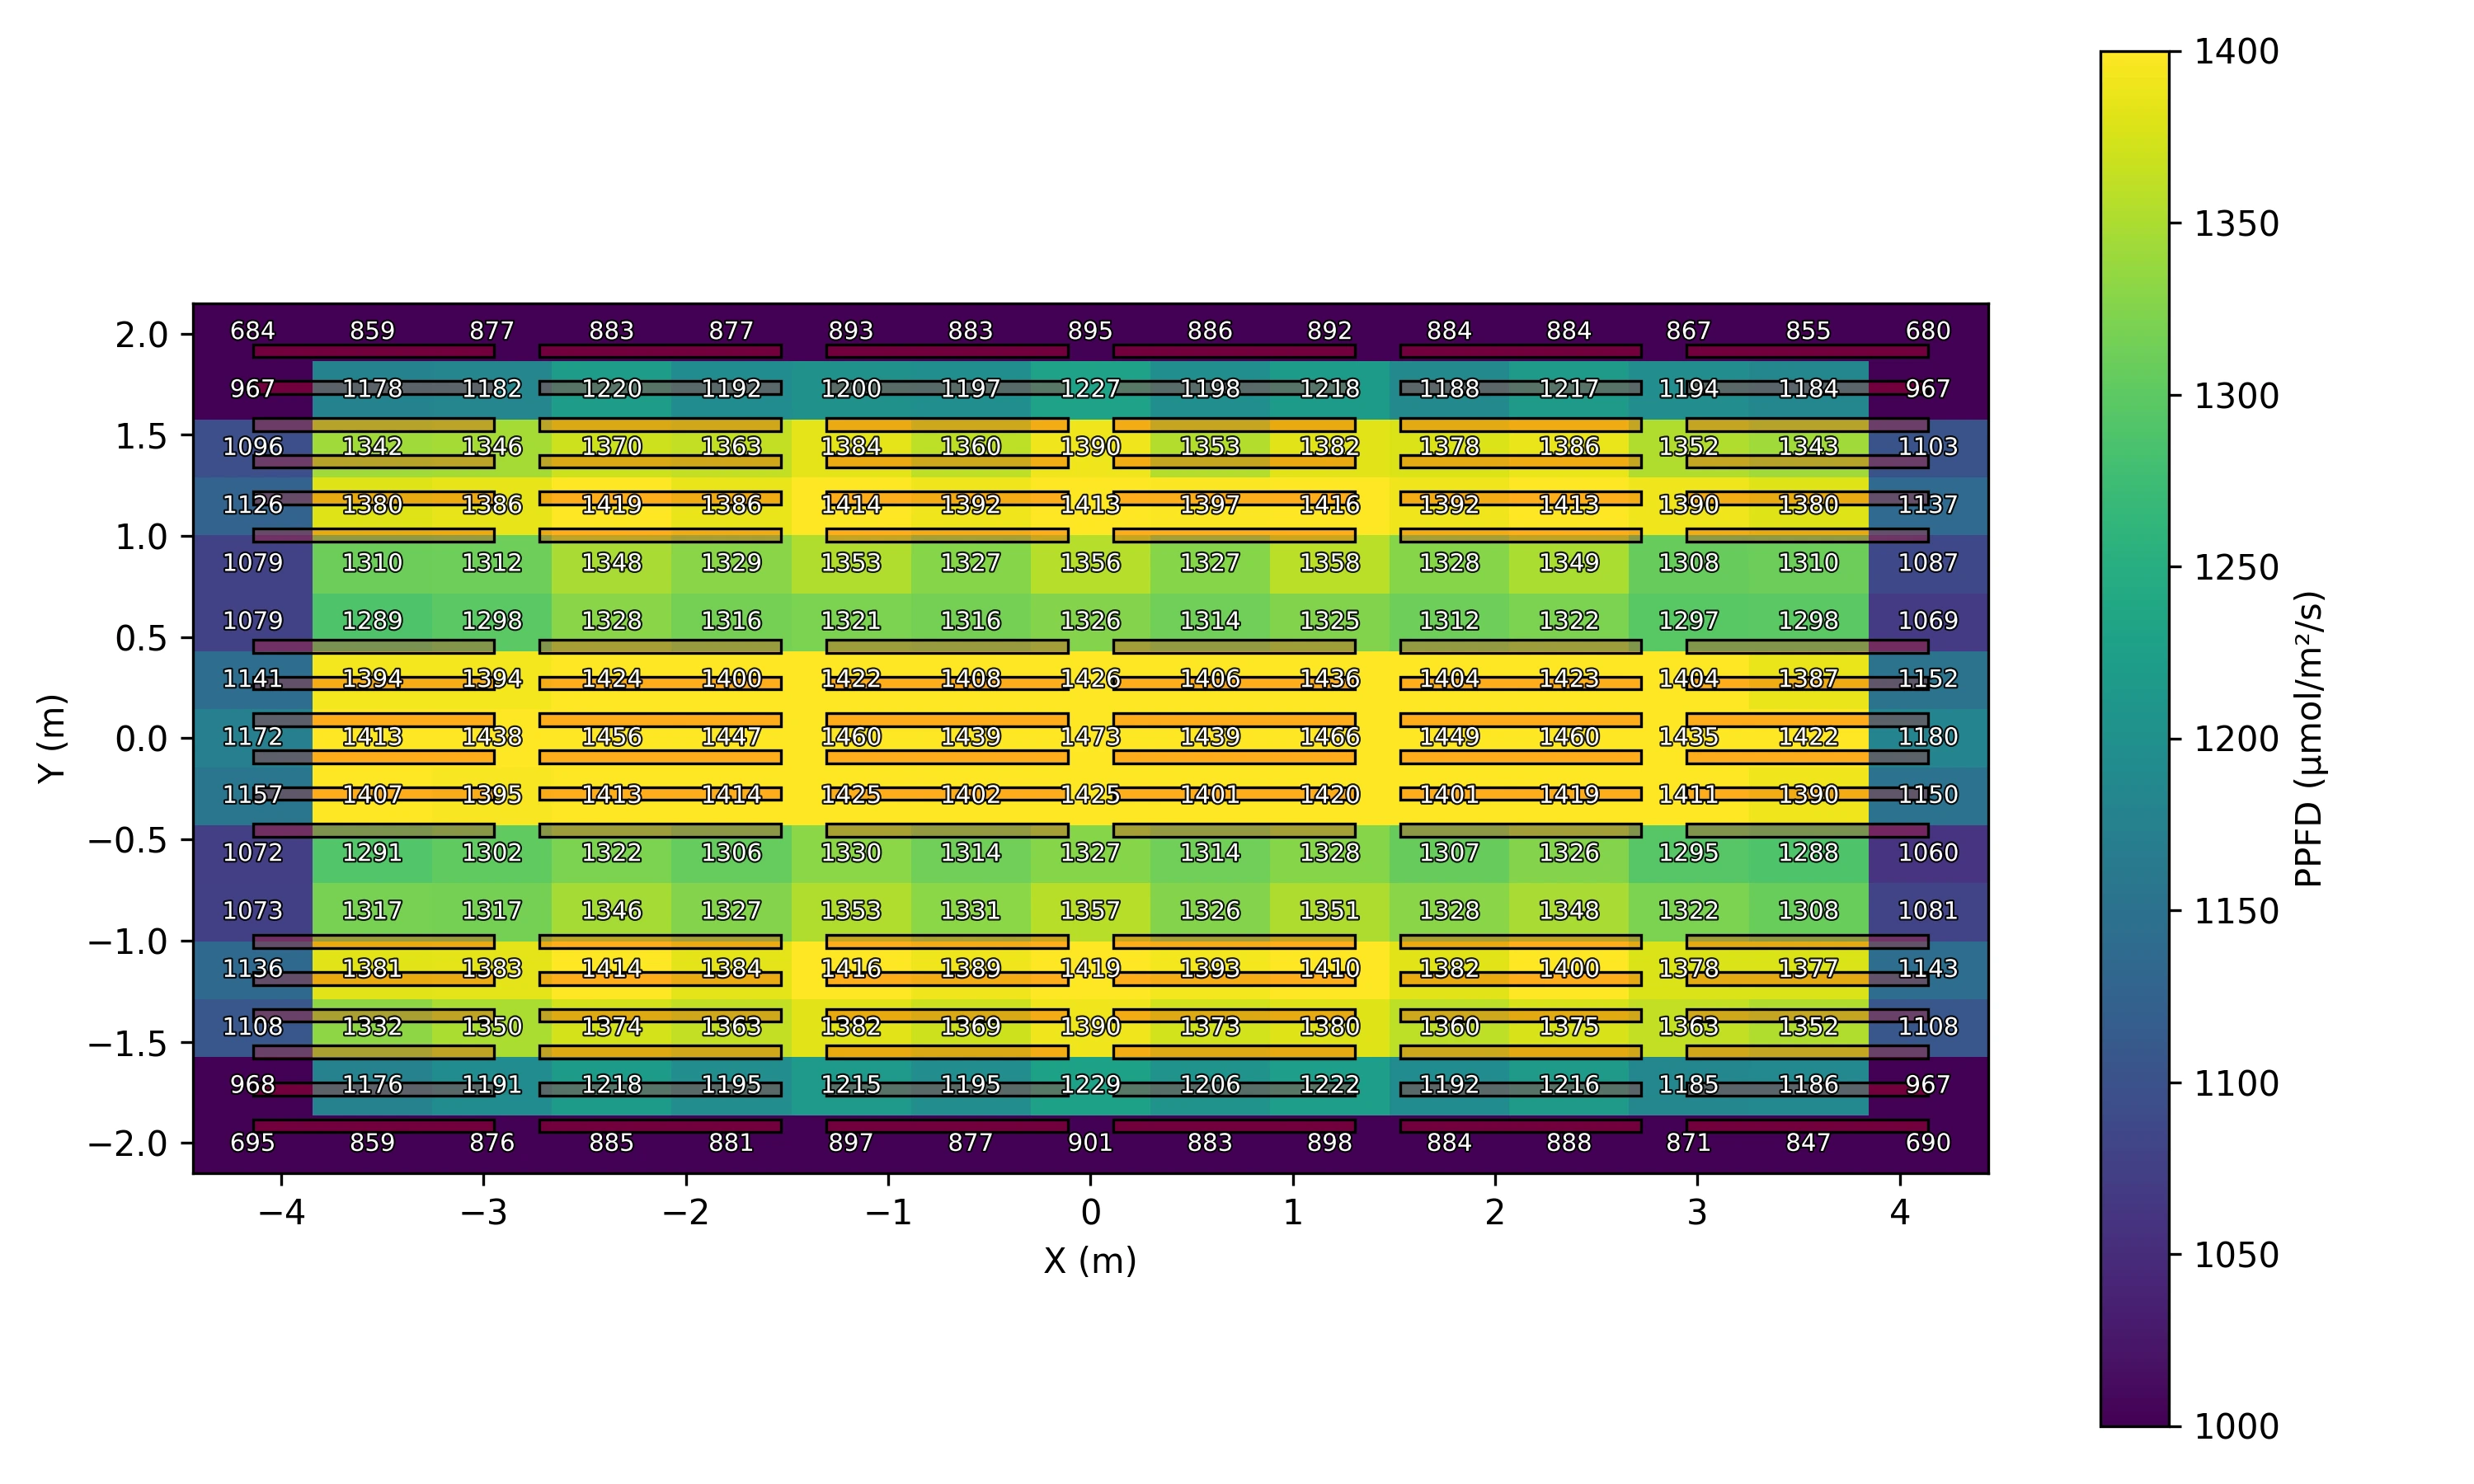
(14’ × 28’ Space — 1,250 PPFD)
Results
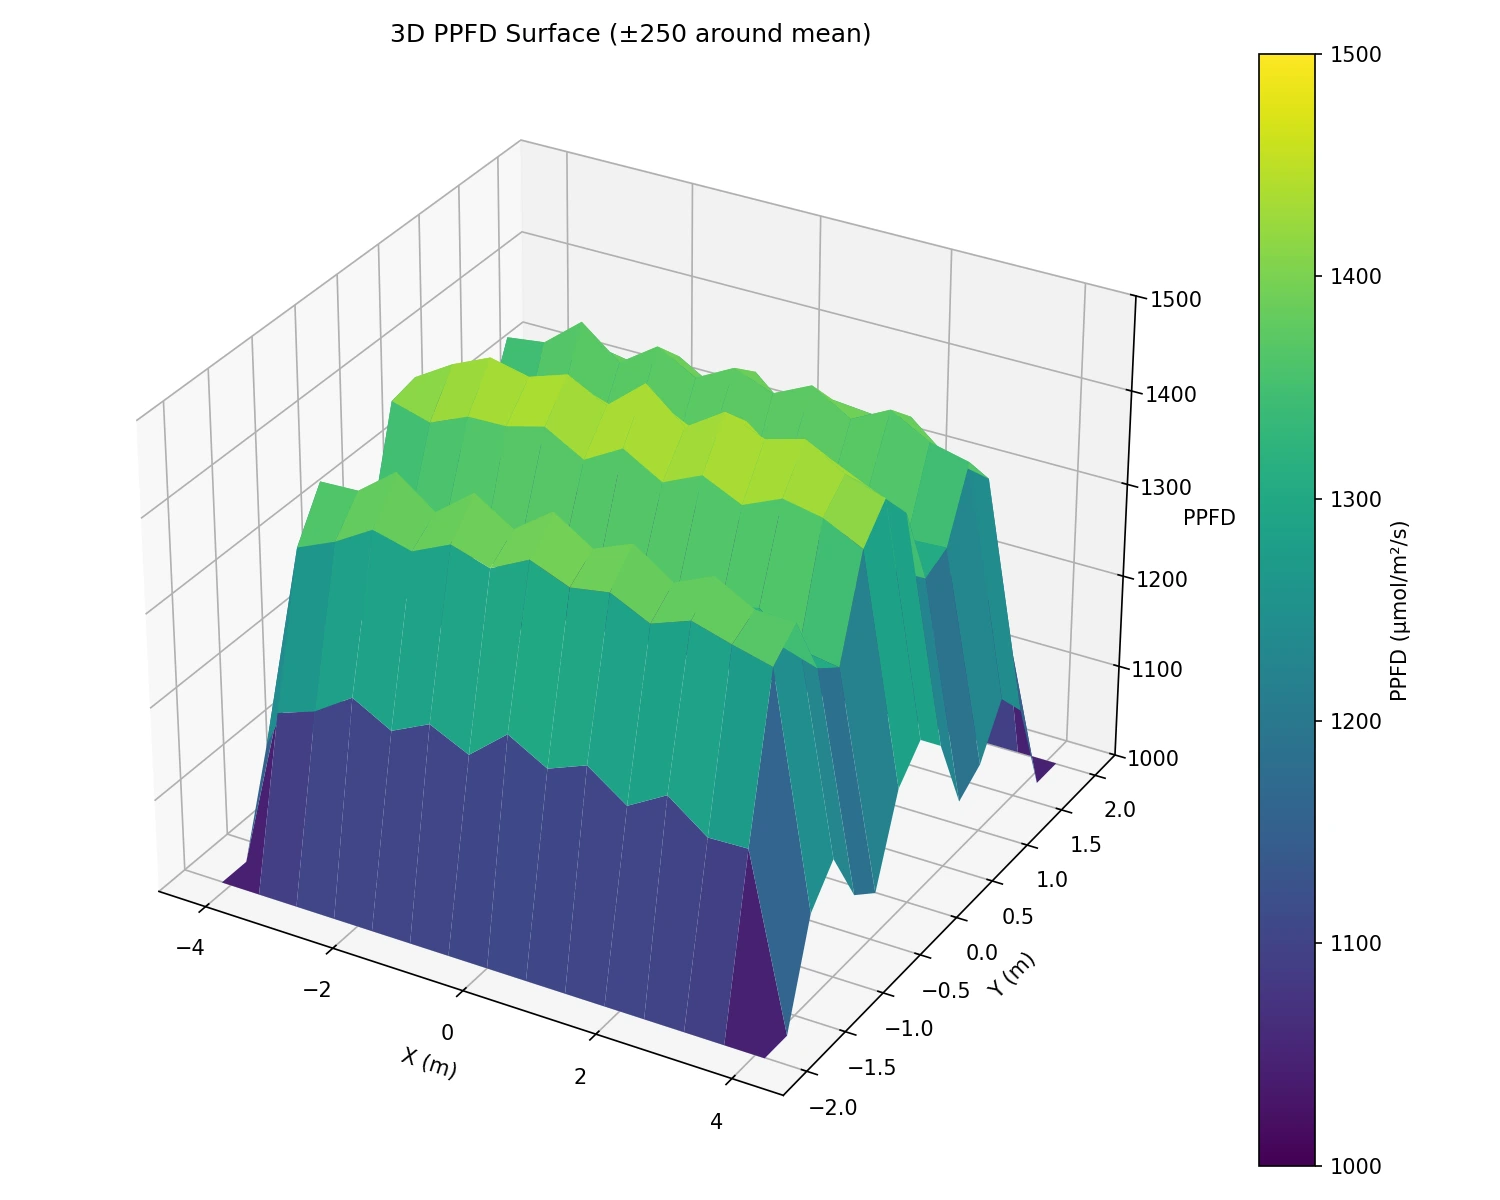
| Metric | Novel System | Conventional System |
|---|---|---|
| Average PPFD | 1,250 | 1,250 |
| RMSE | 14.5 | 188.9 |
| DOU (%) | 98.84 | 84.89 |
| MAD | 9.8 | 153.5 |
| CV (%) | 1.16 | 15.11 |
| Min/Max PPFD | 0.907 | 0.462 |
| Min/Avg PPFD | 0.947 | 0.544 |
Conclusion
In horticultural lighting, uniformity is king. Our photonic density uniformity solver integrated with Radiance enables maximal DOU at minimal input power for a target PPFD. This capability, combined with spectral tunability from our custom SMD LED modules and the infinitely scalable nature of our modularized LED system, is the holy grail in horticultural lighting design.
While some competitors try to compensate for poor top-down uniformity with intracanopy lighting, that simply adds input power to accomplish what a high-uniformity top-down system can achieve by design.
What the literature says
References
- Joshi, J., Zhang, G., Shen, S., Supaibulwatana, K., Watanabe, C., & Yamori, W. (2017). A combination of downward lighting and supplemental upward lighting improves plant growth in a closed plant factory with artificial lighting. HortScience, 52(6), 831–835. https://doi.org/10.21273/HORTSCI11822-17
- Kozai, T. (2022). Role and characteristics of PFALs. In Plant Factory: Basics, Applications and Advances (p. 46). Academic Press.
Talk with our Principal Investigator
Level up your grow with a personal consultation. Our founder—principal investigator for our research and inventor of our product line—will help you optimize your operation and answer any technical questions.