White paper

Killing Hotspots: New LED Grow Light That Isn’t Bars or Boards

LEDs are everywhere now in cannabis cultivation, but most of the options look and behave the same. We have been working on a completely different way to light a grow space, and it is backed by real simulation data, not marketing slides.

“If you can’t explain it simply, you don’t understand it well enough.” – Albert Einstein

Explore layouts

Plain-language updates about uniformity, spectrum, and real test results.

What actually matters in an LED grow light?

For me it comes down to two things: spectrum and uniformity.

Uniformity

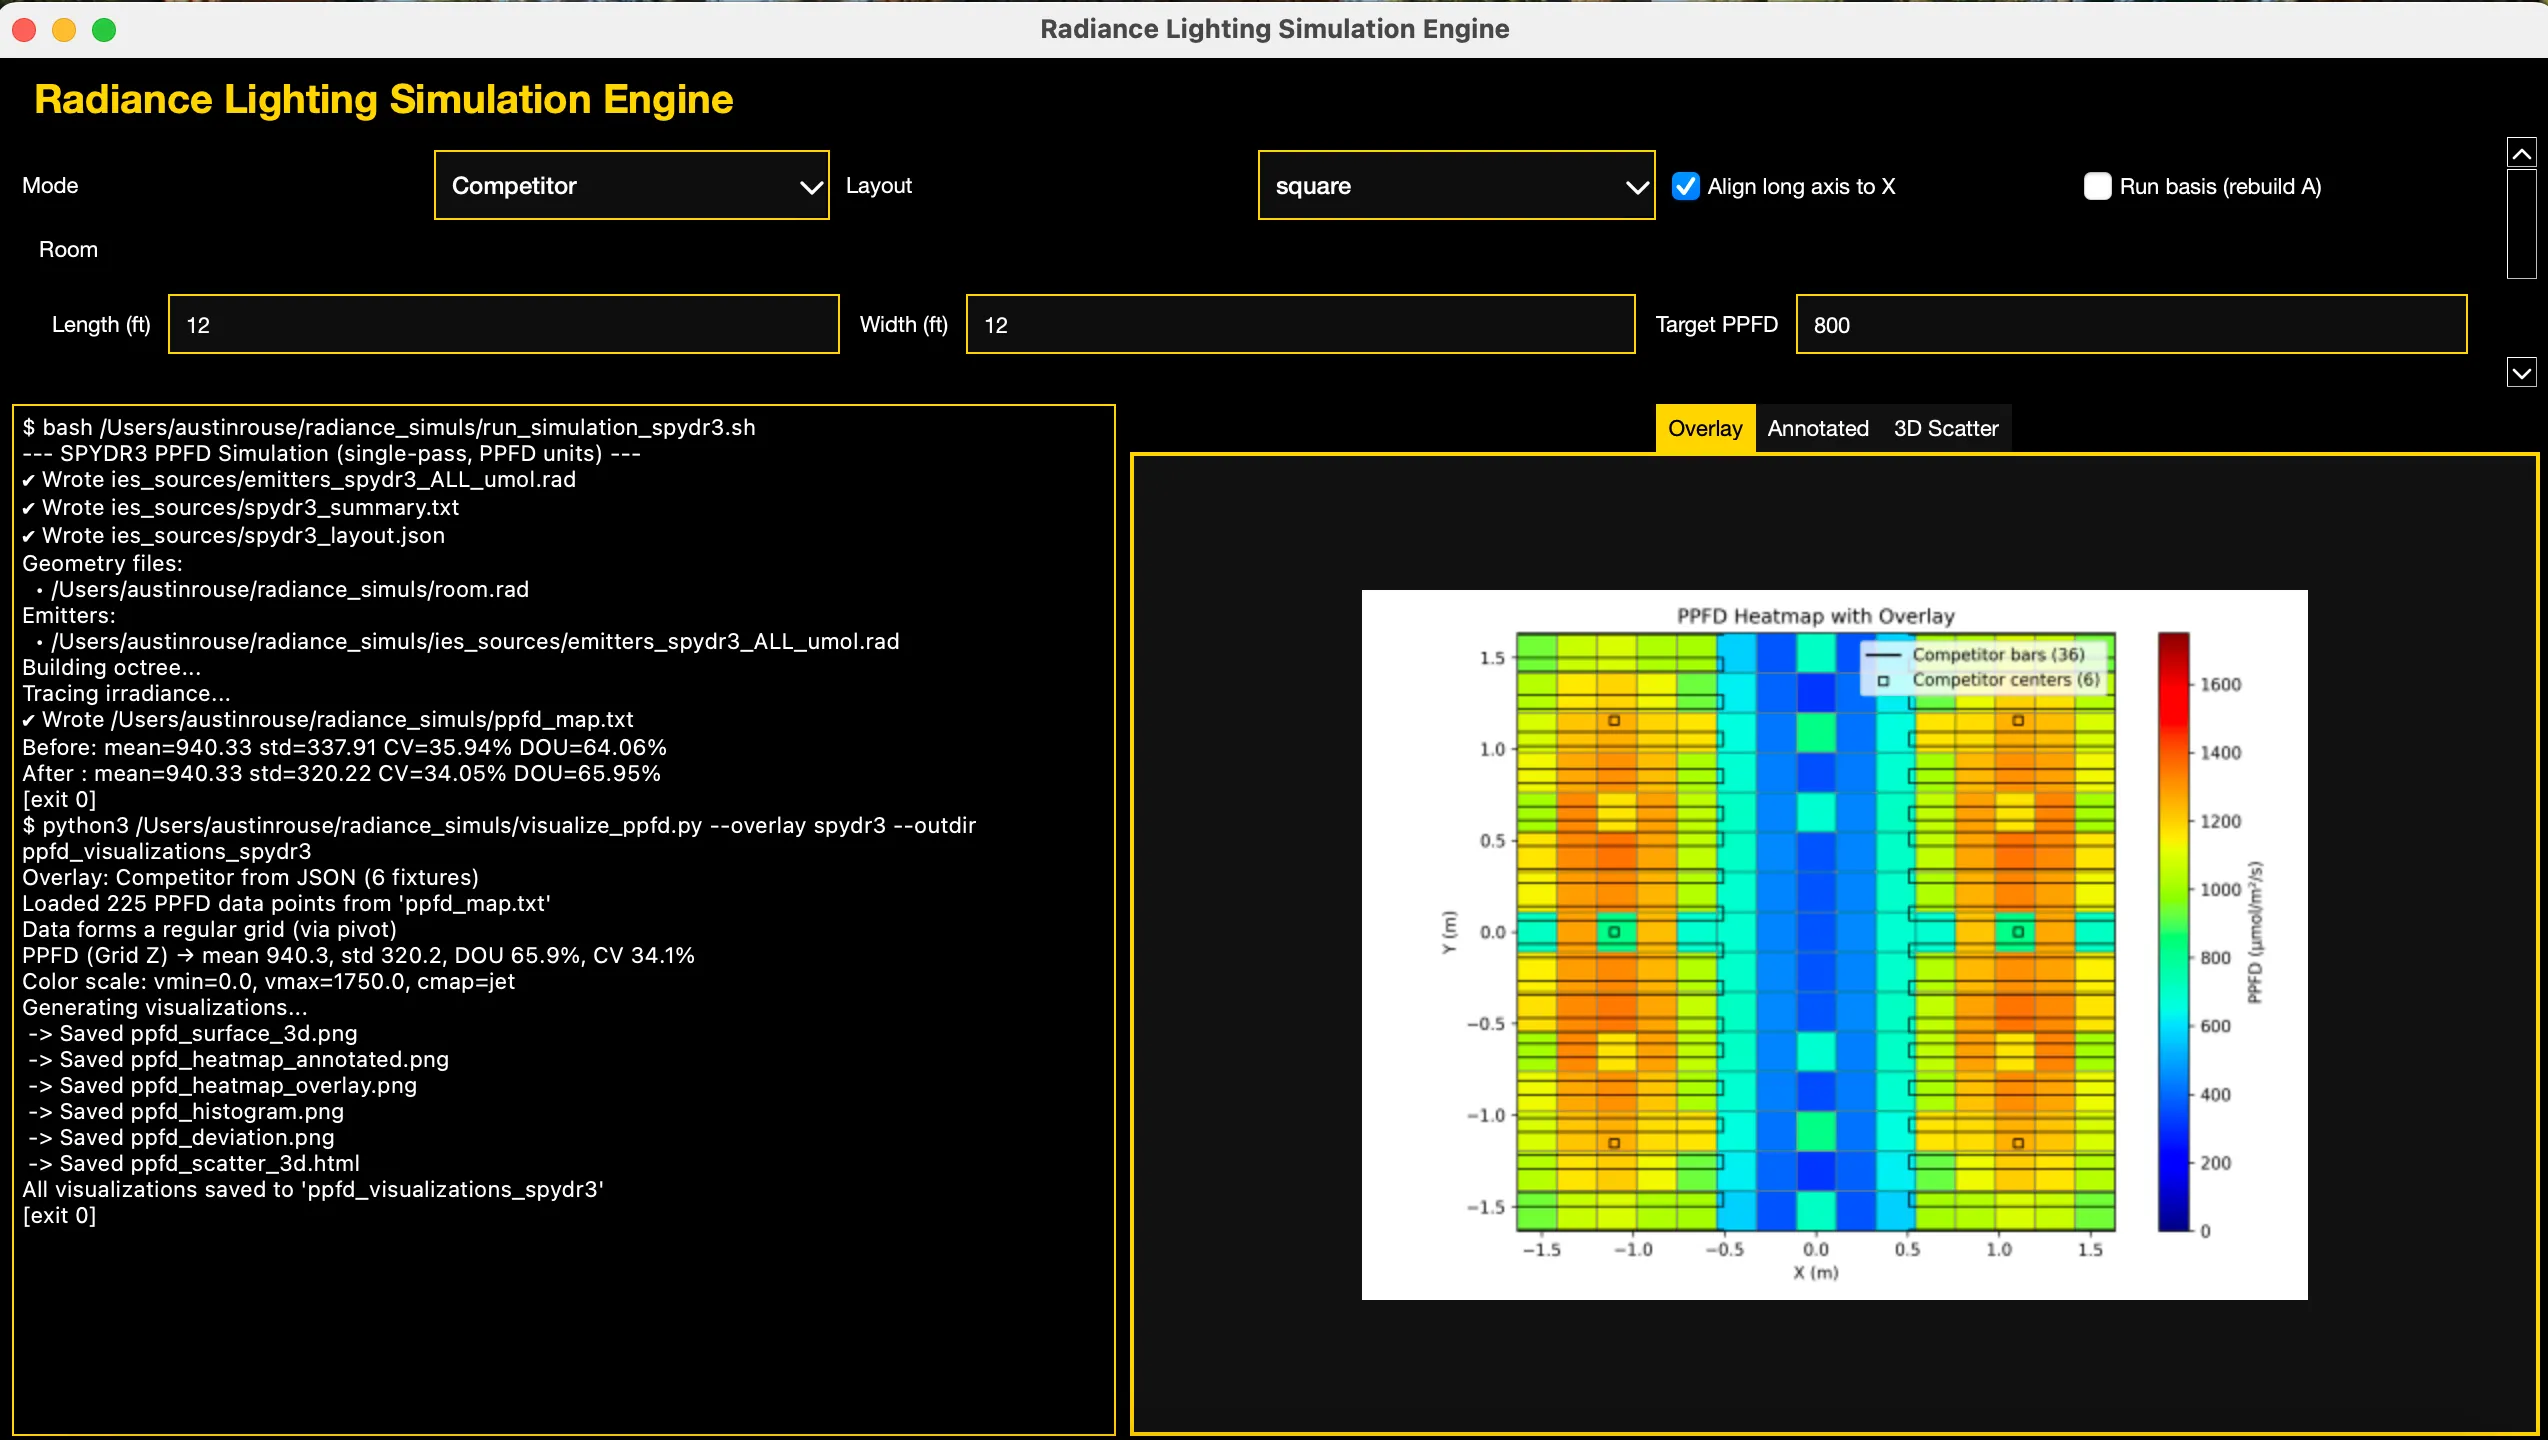
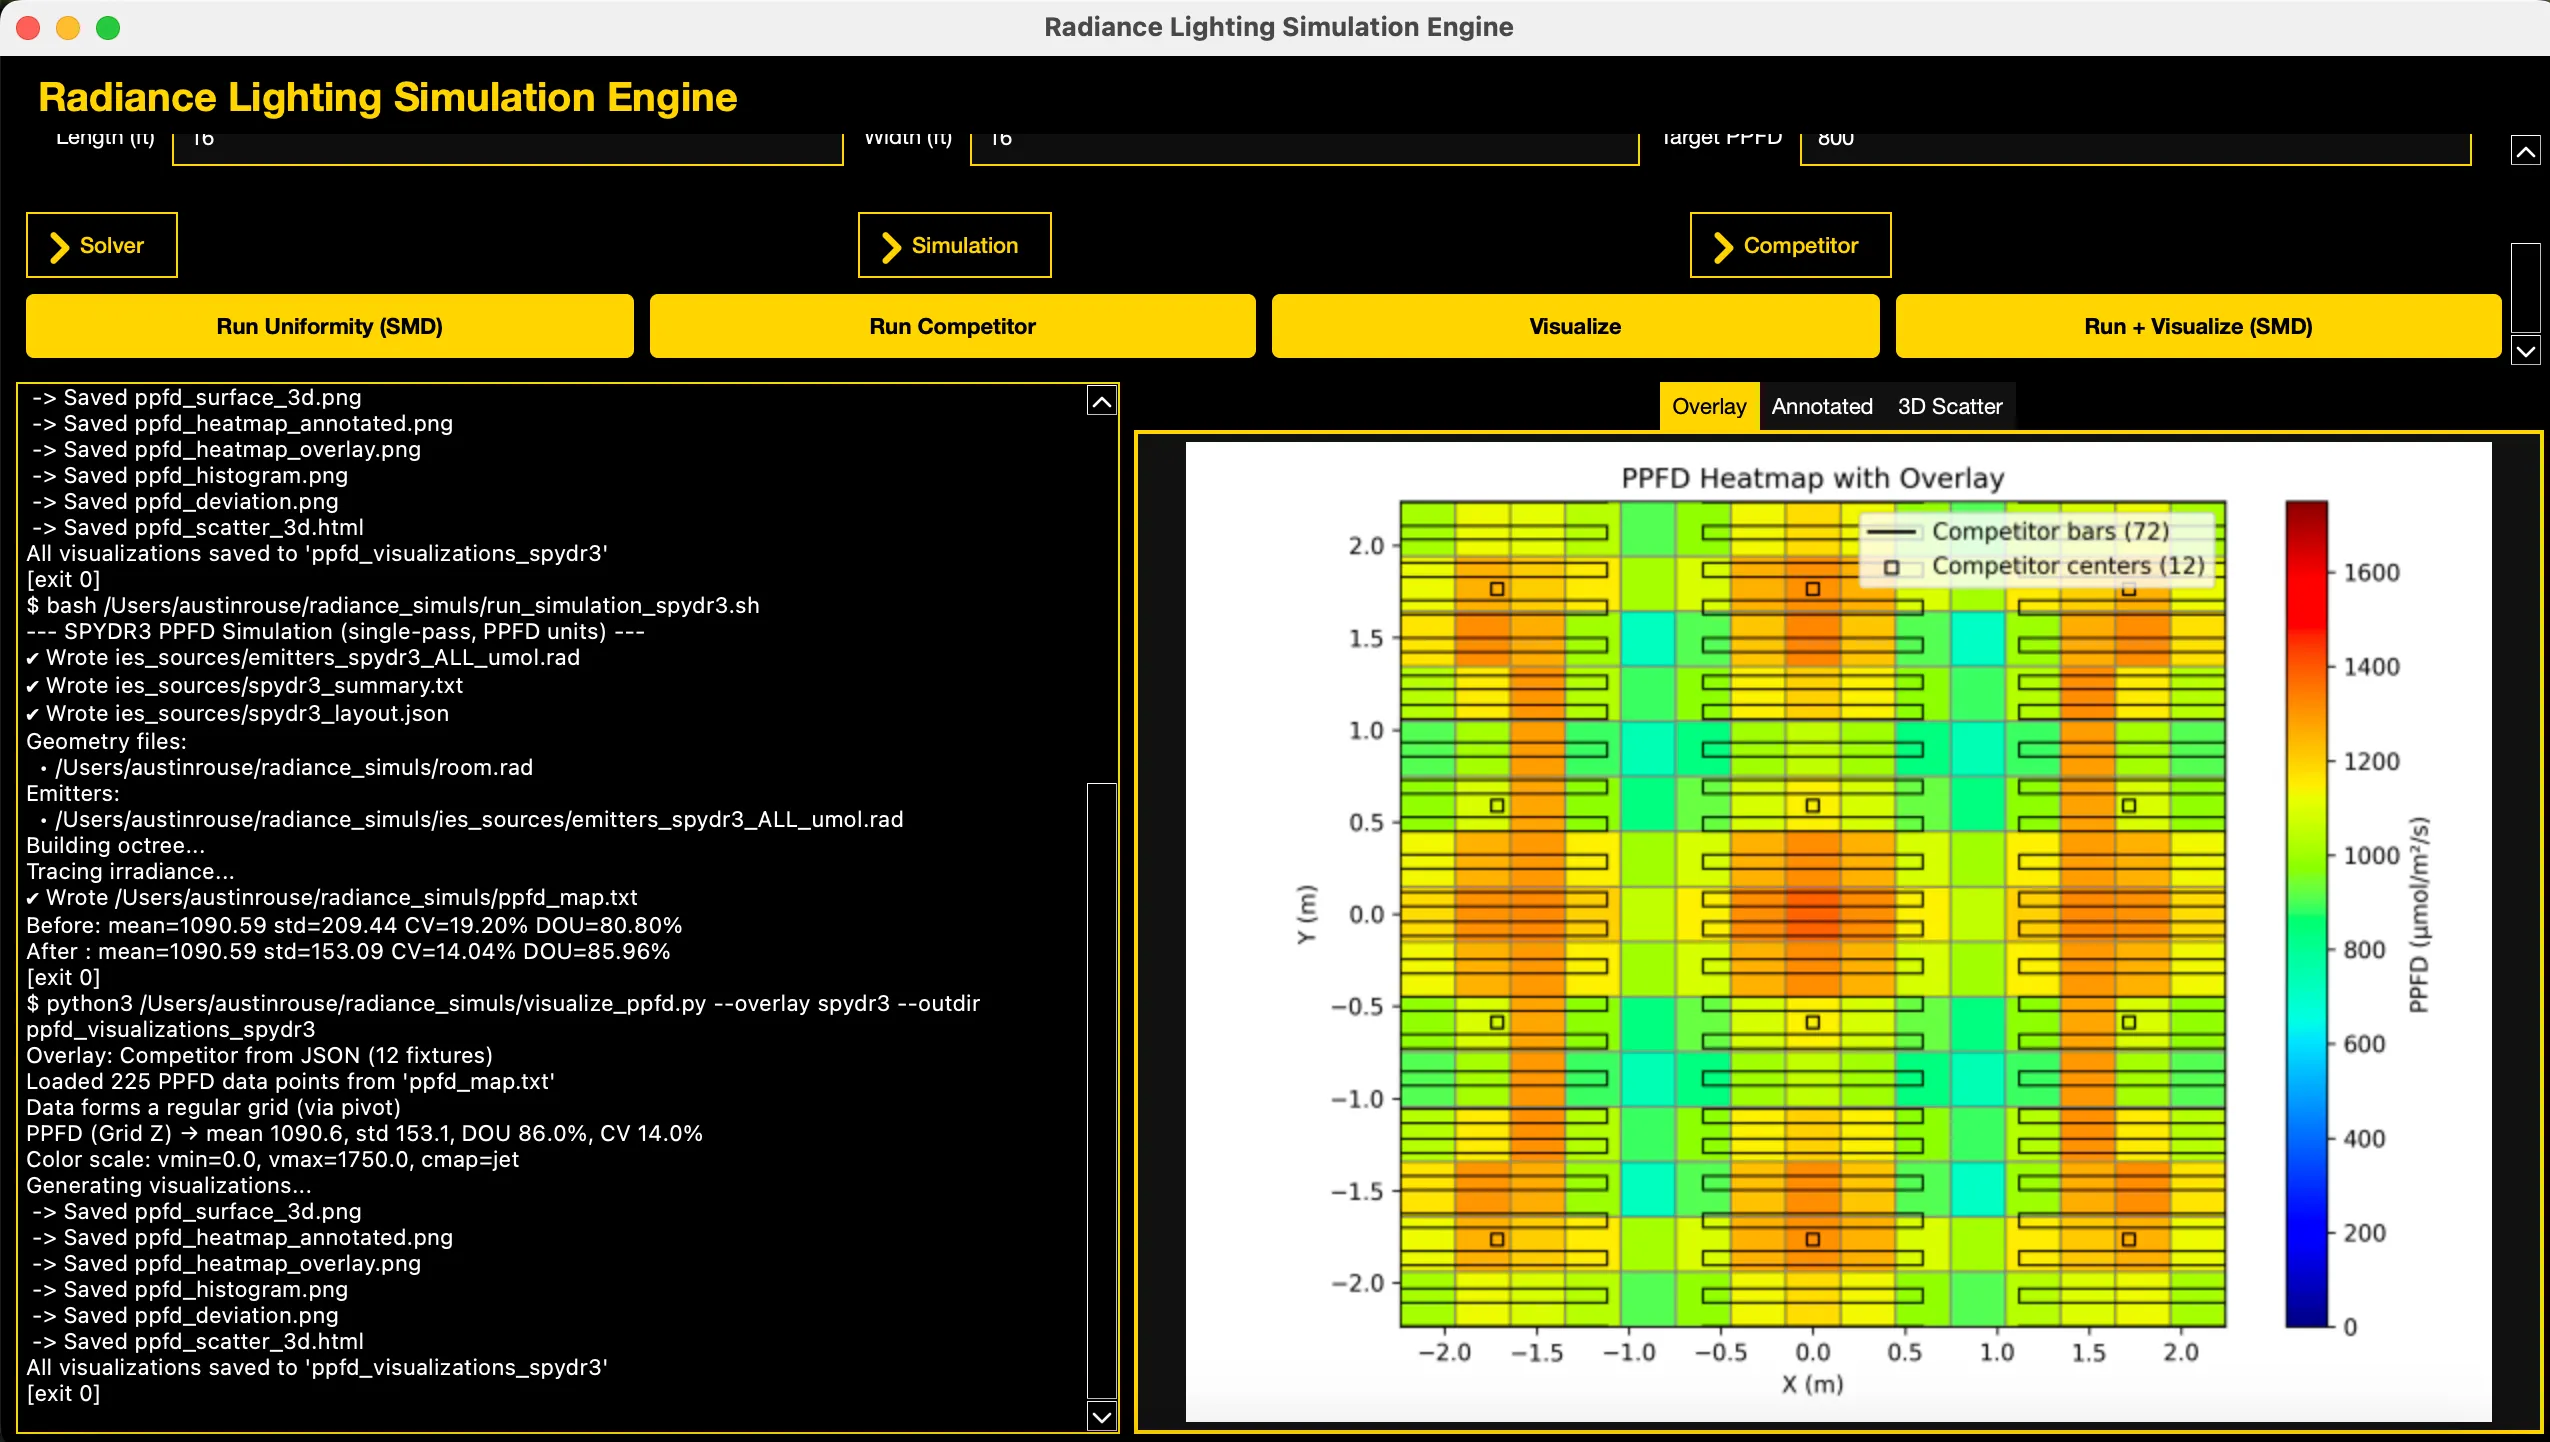
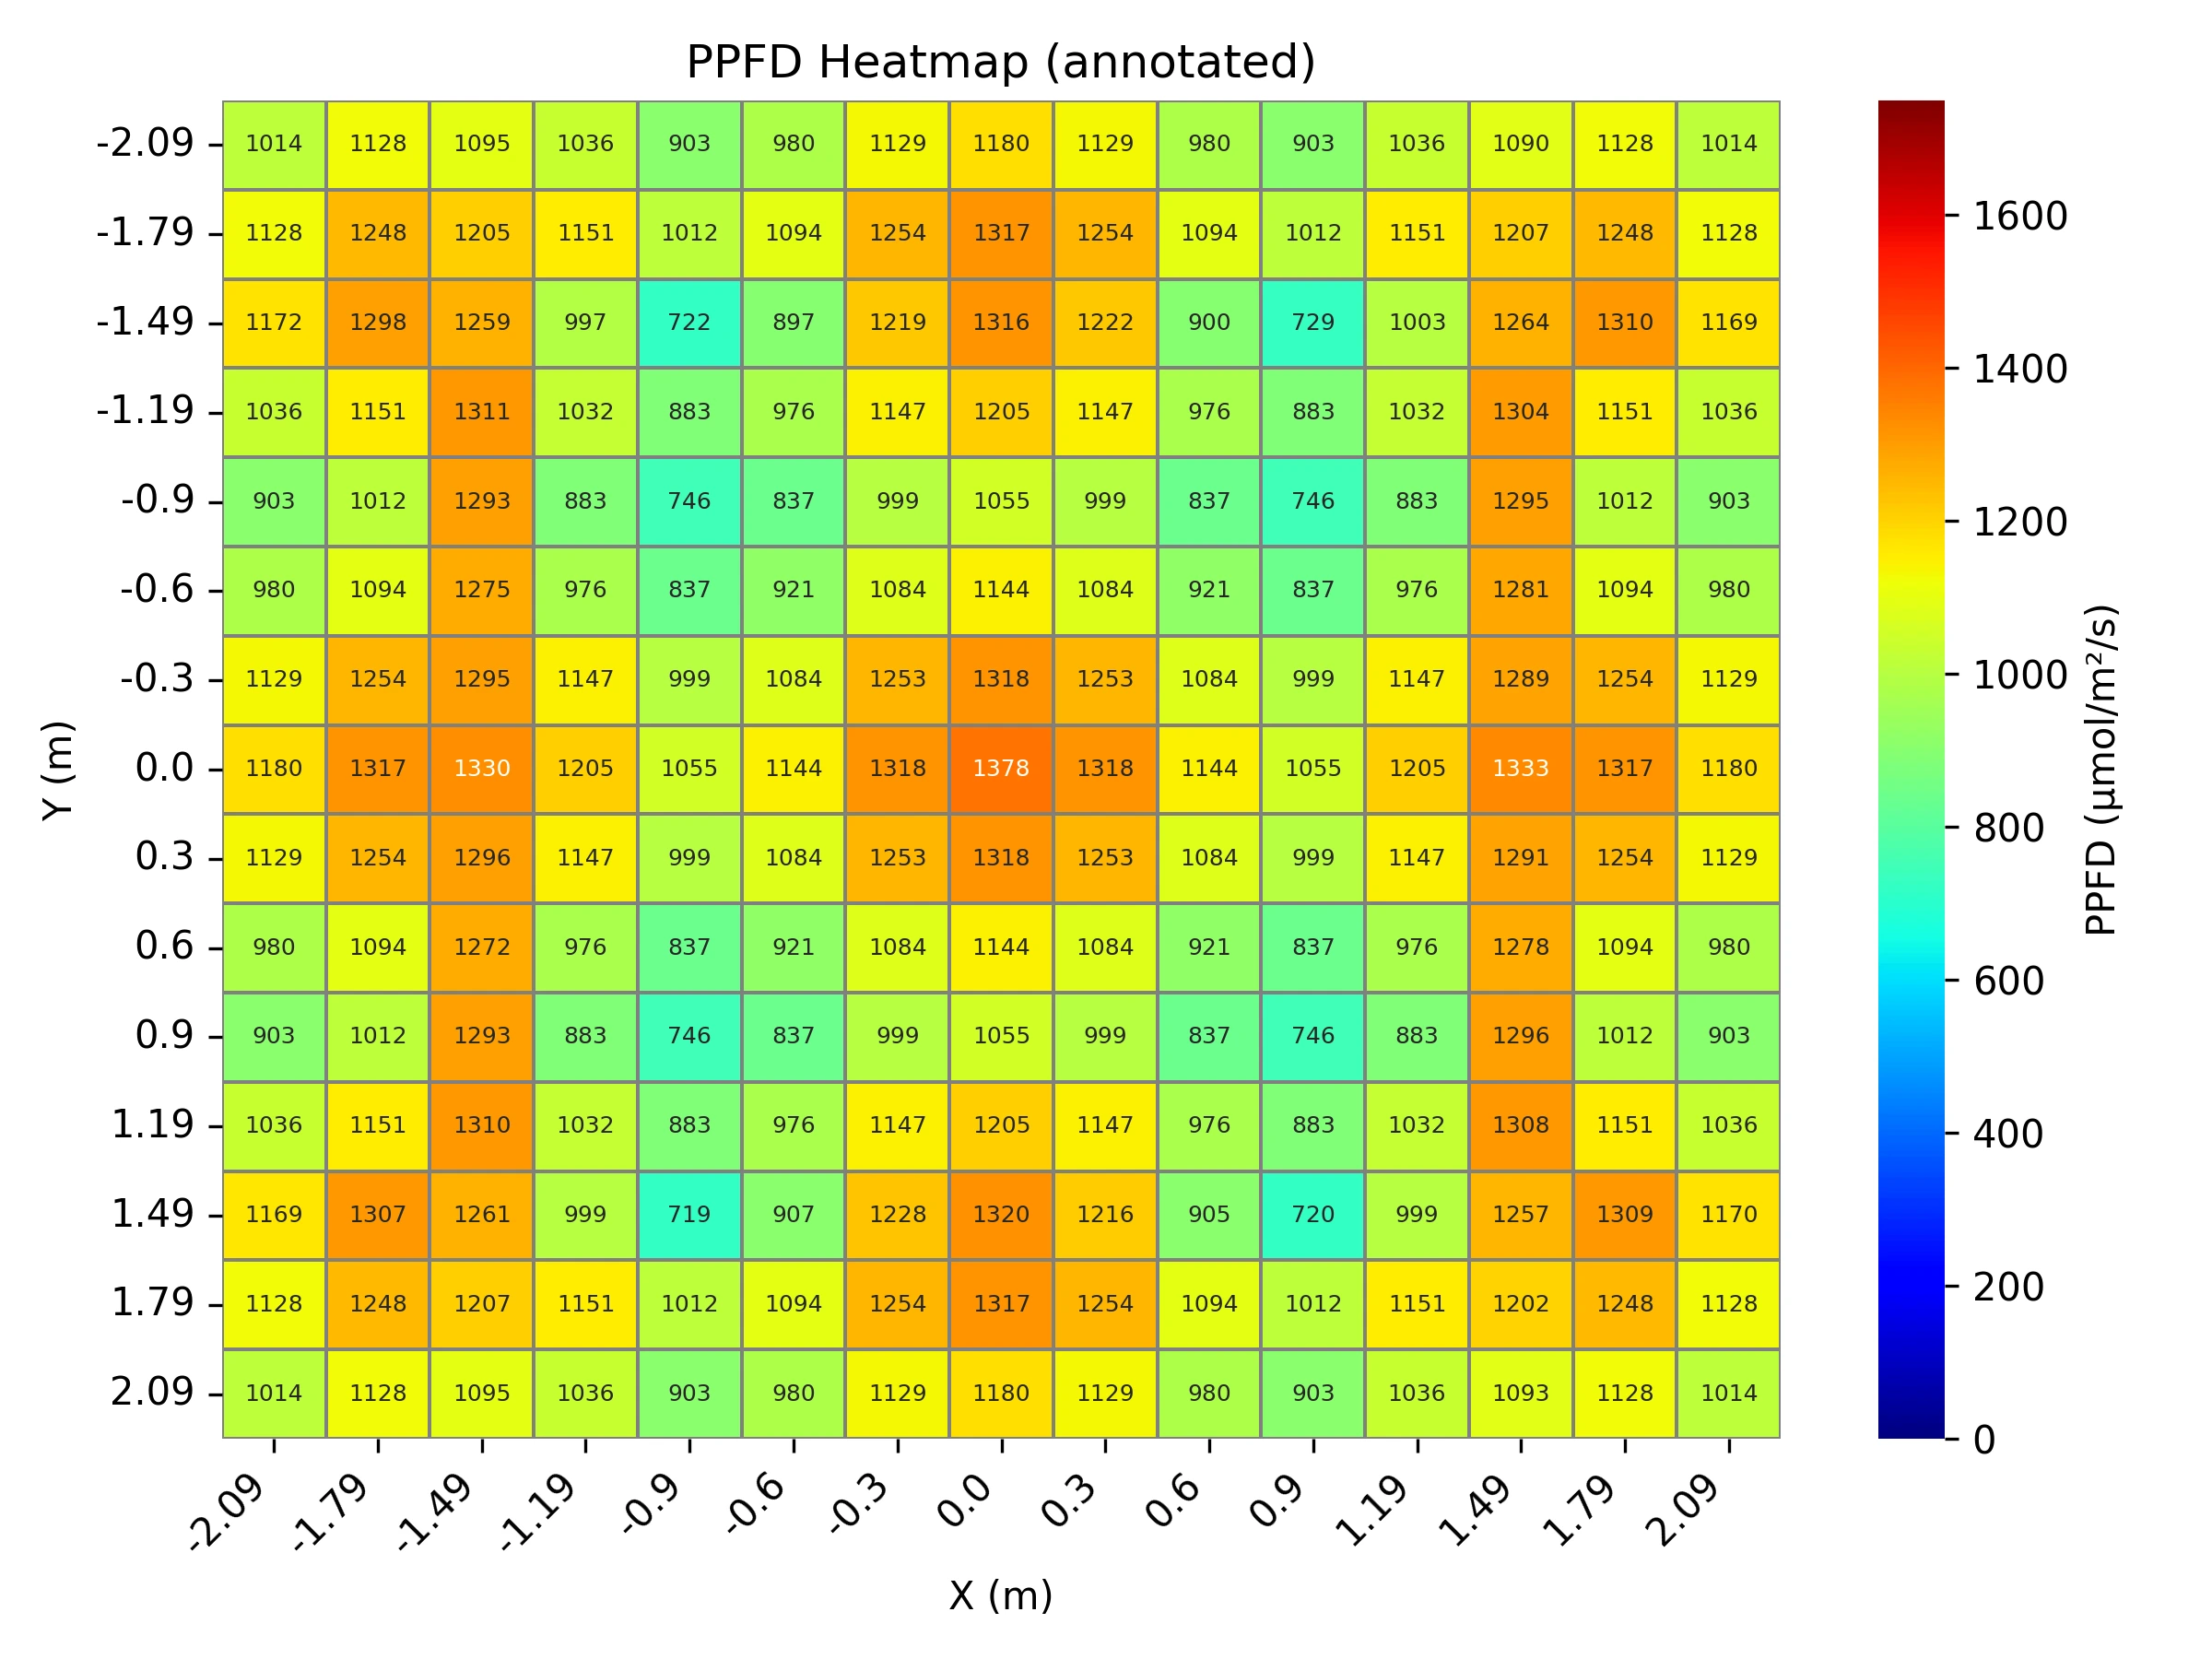
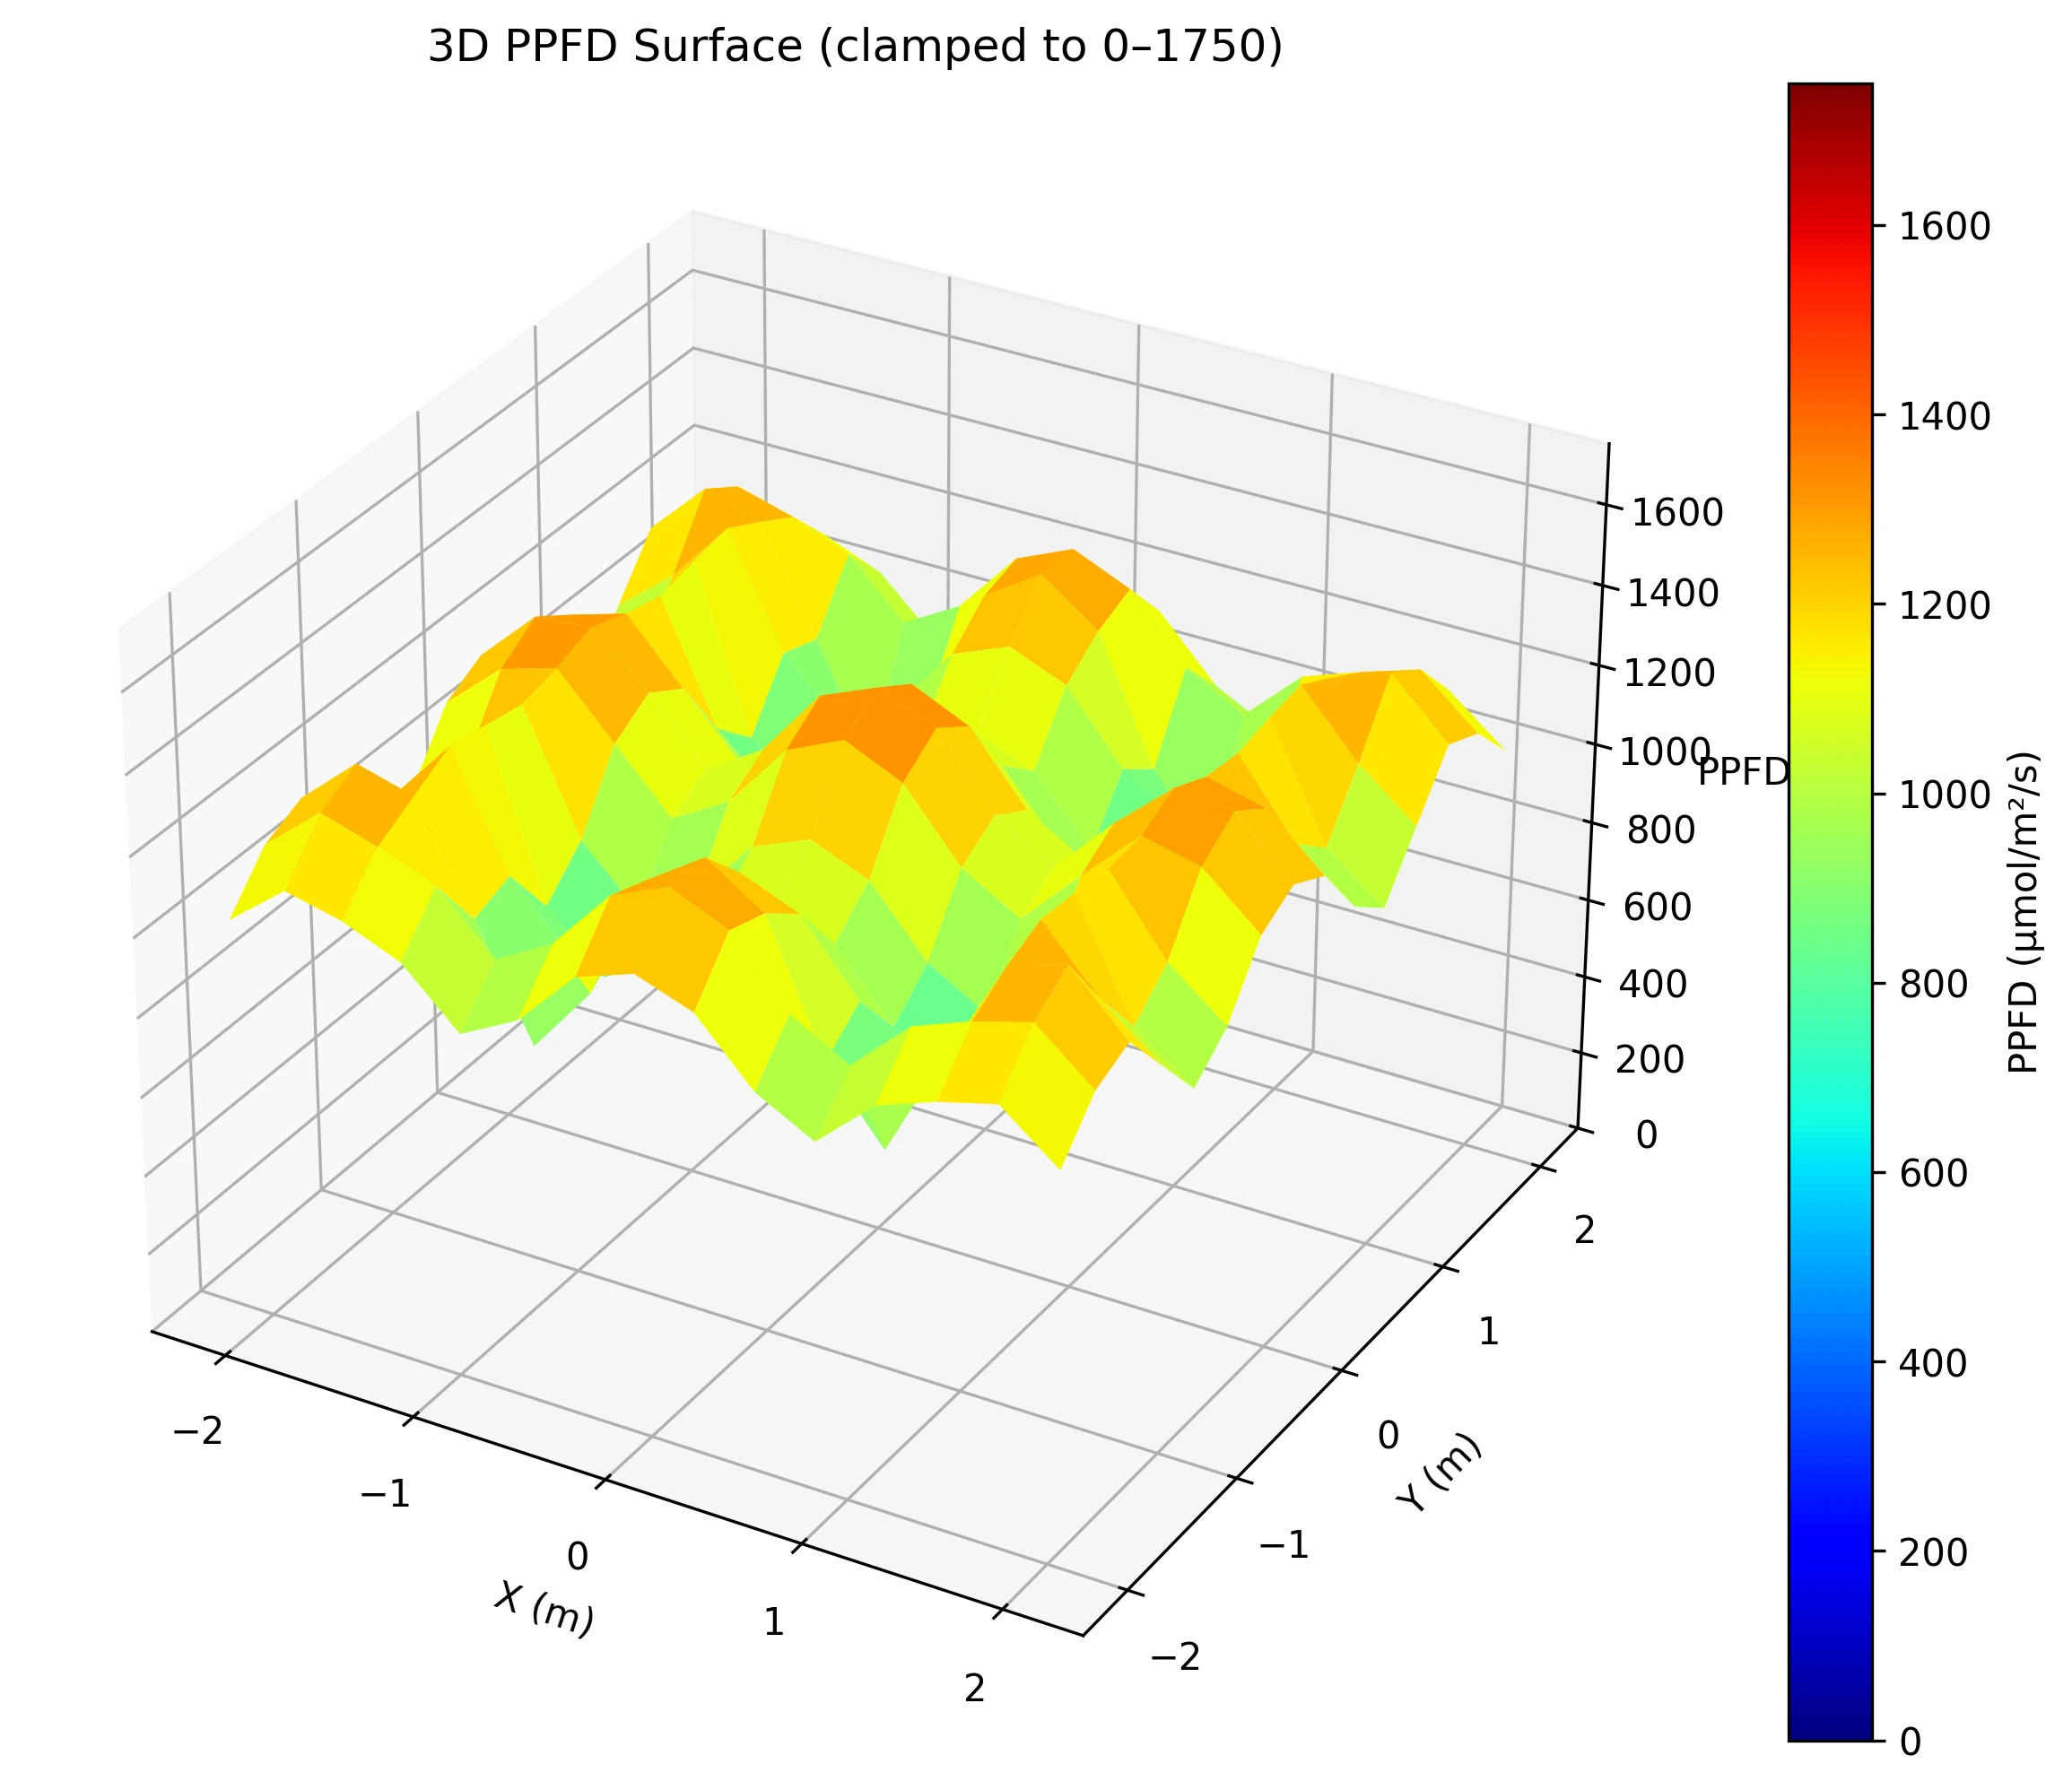
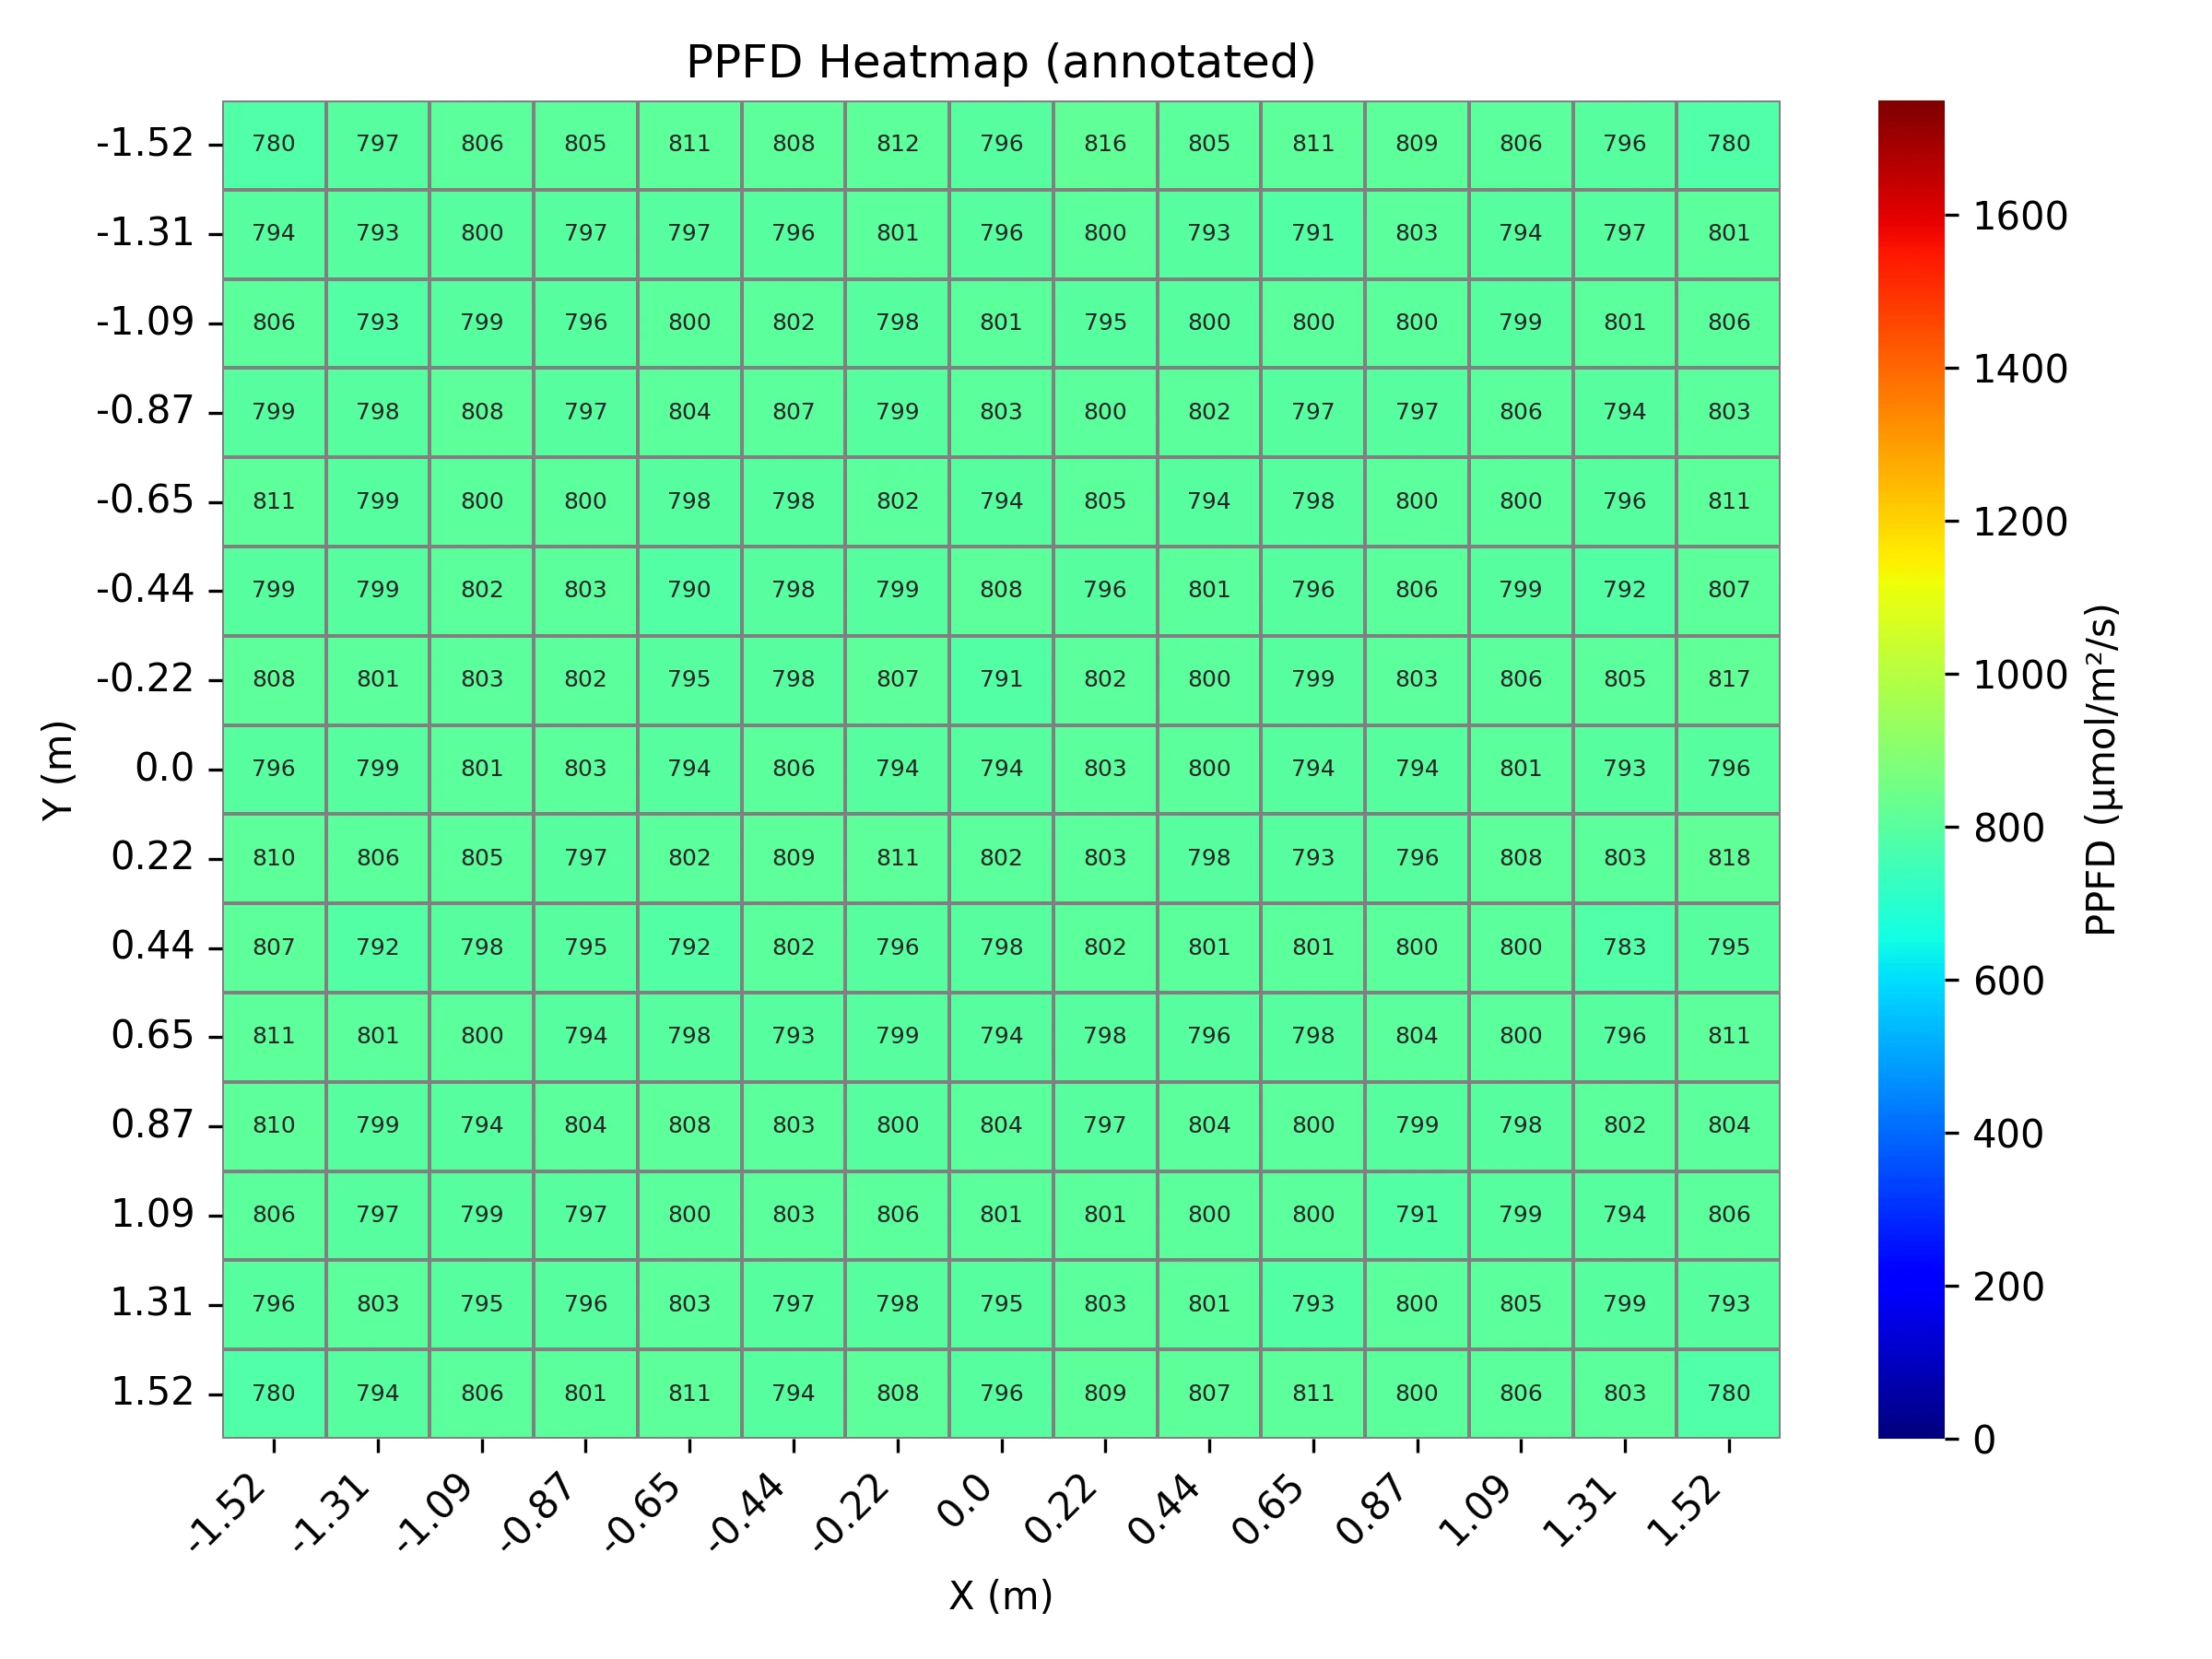
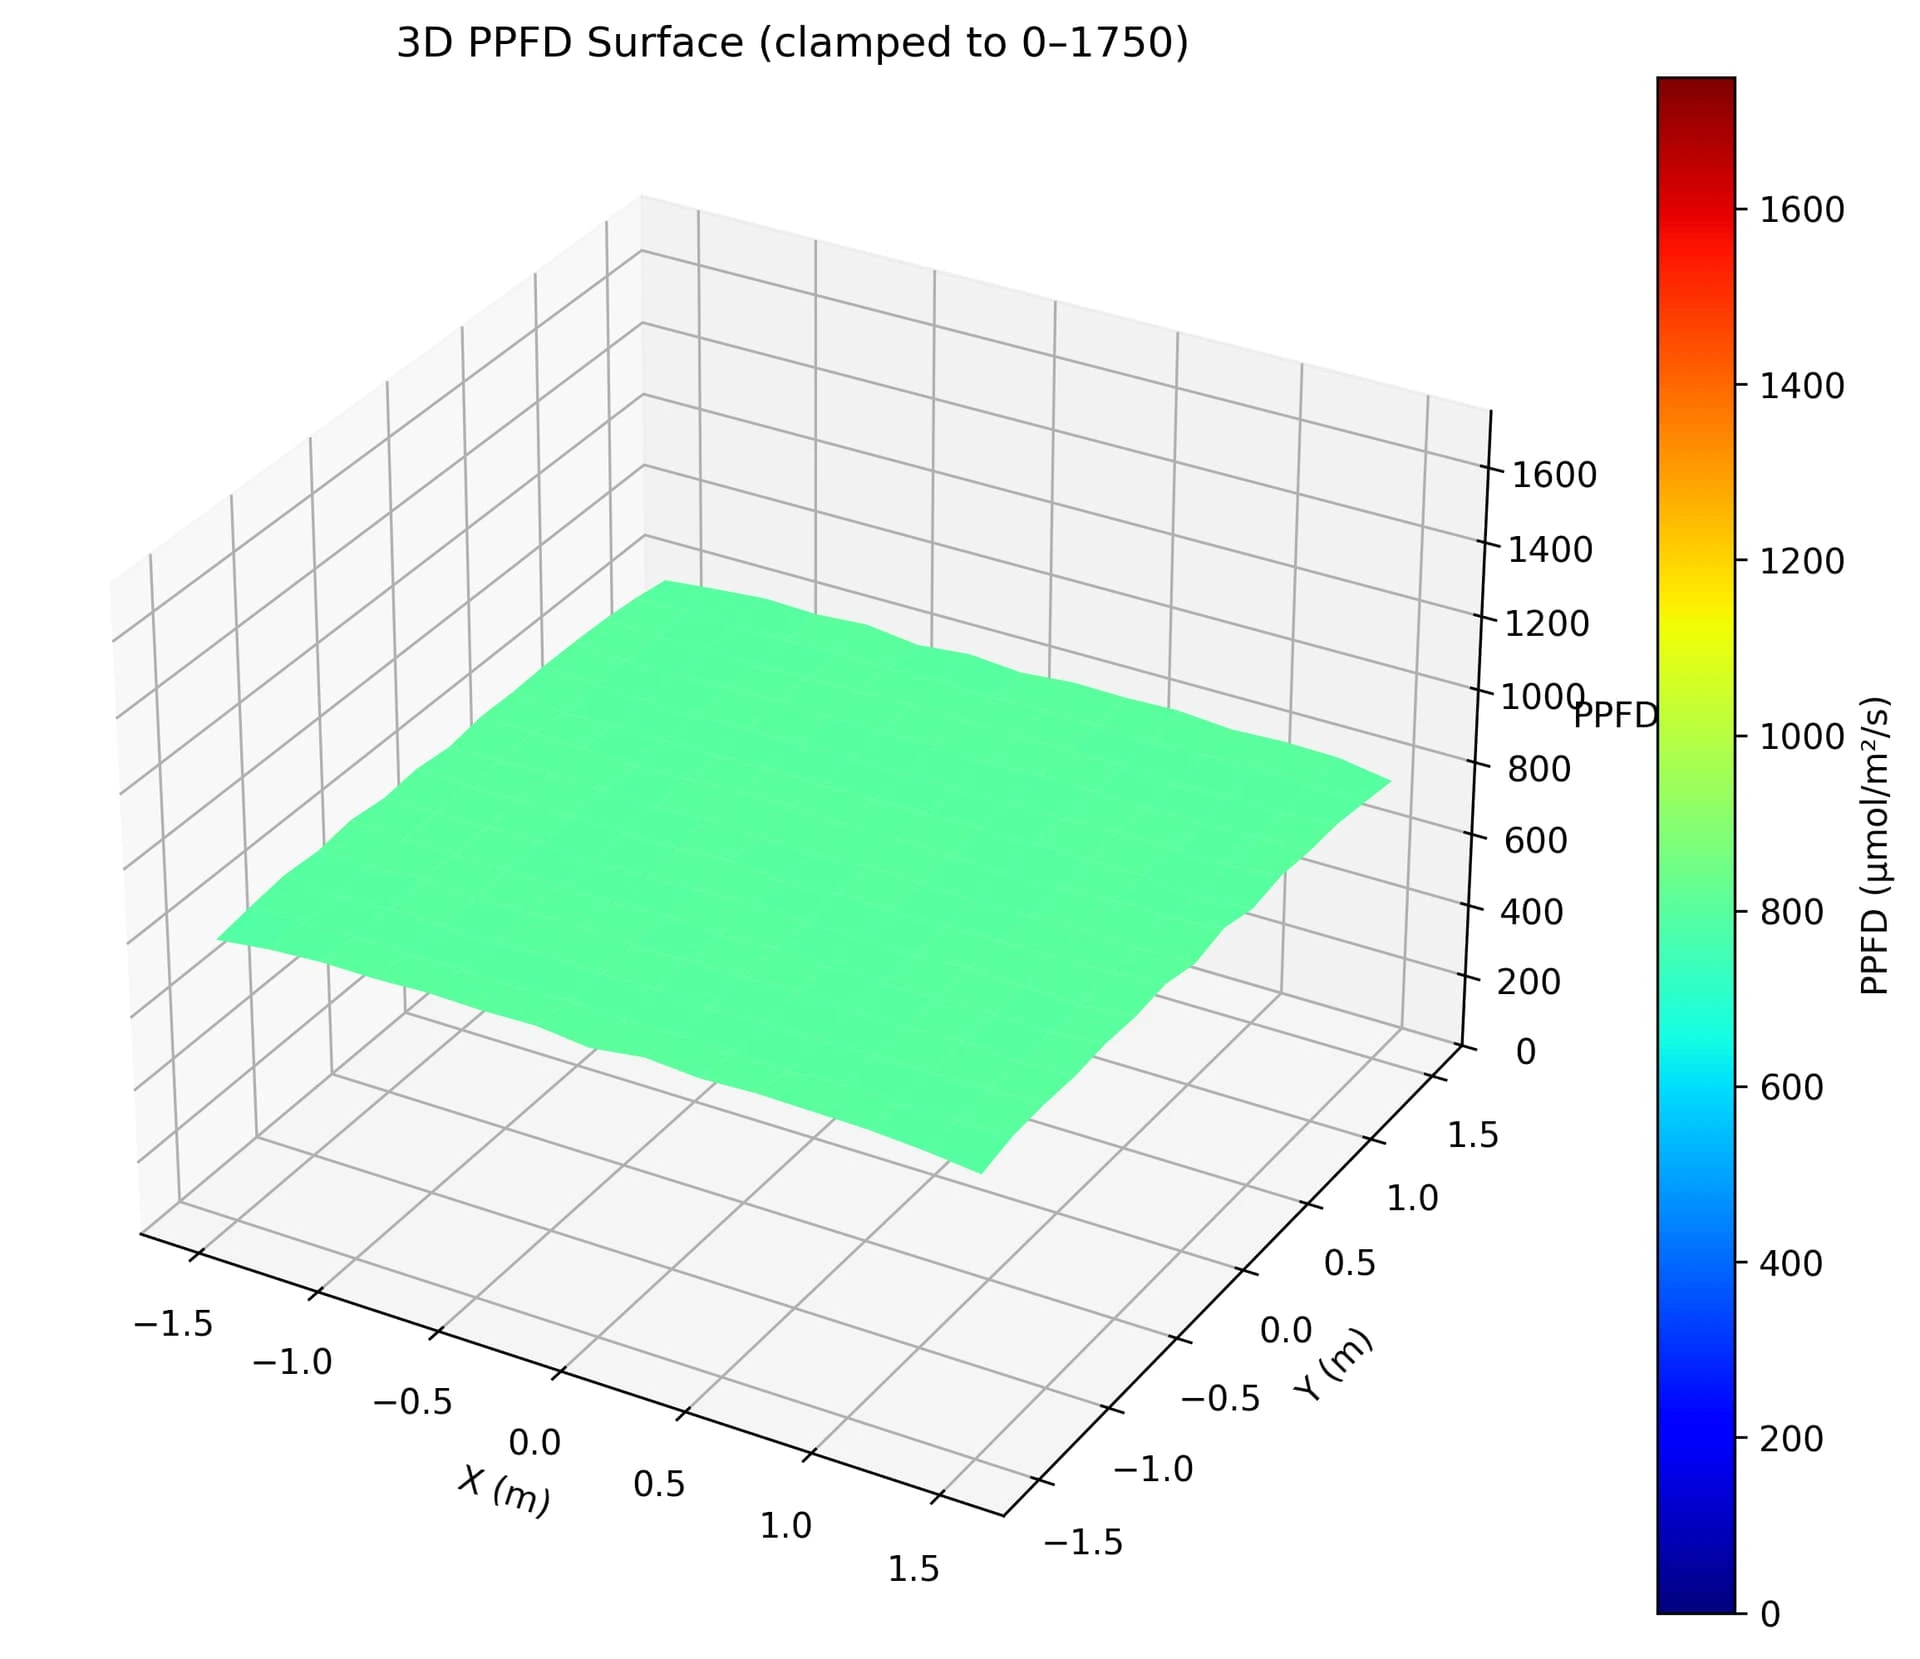
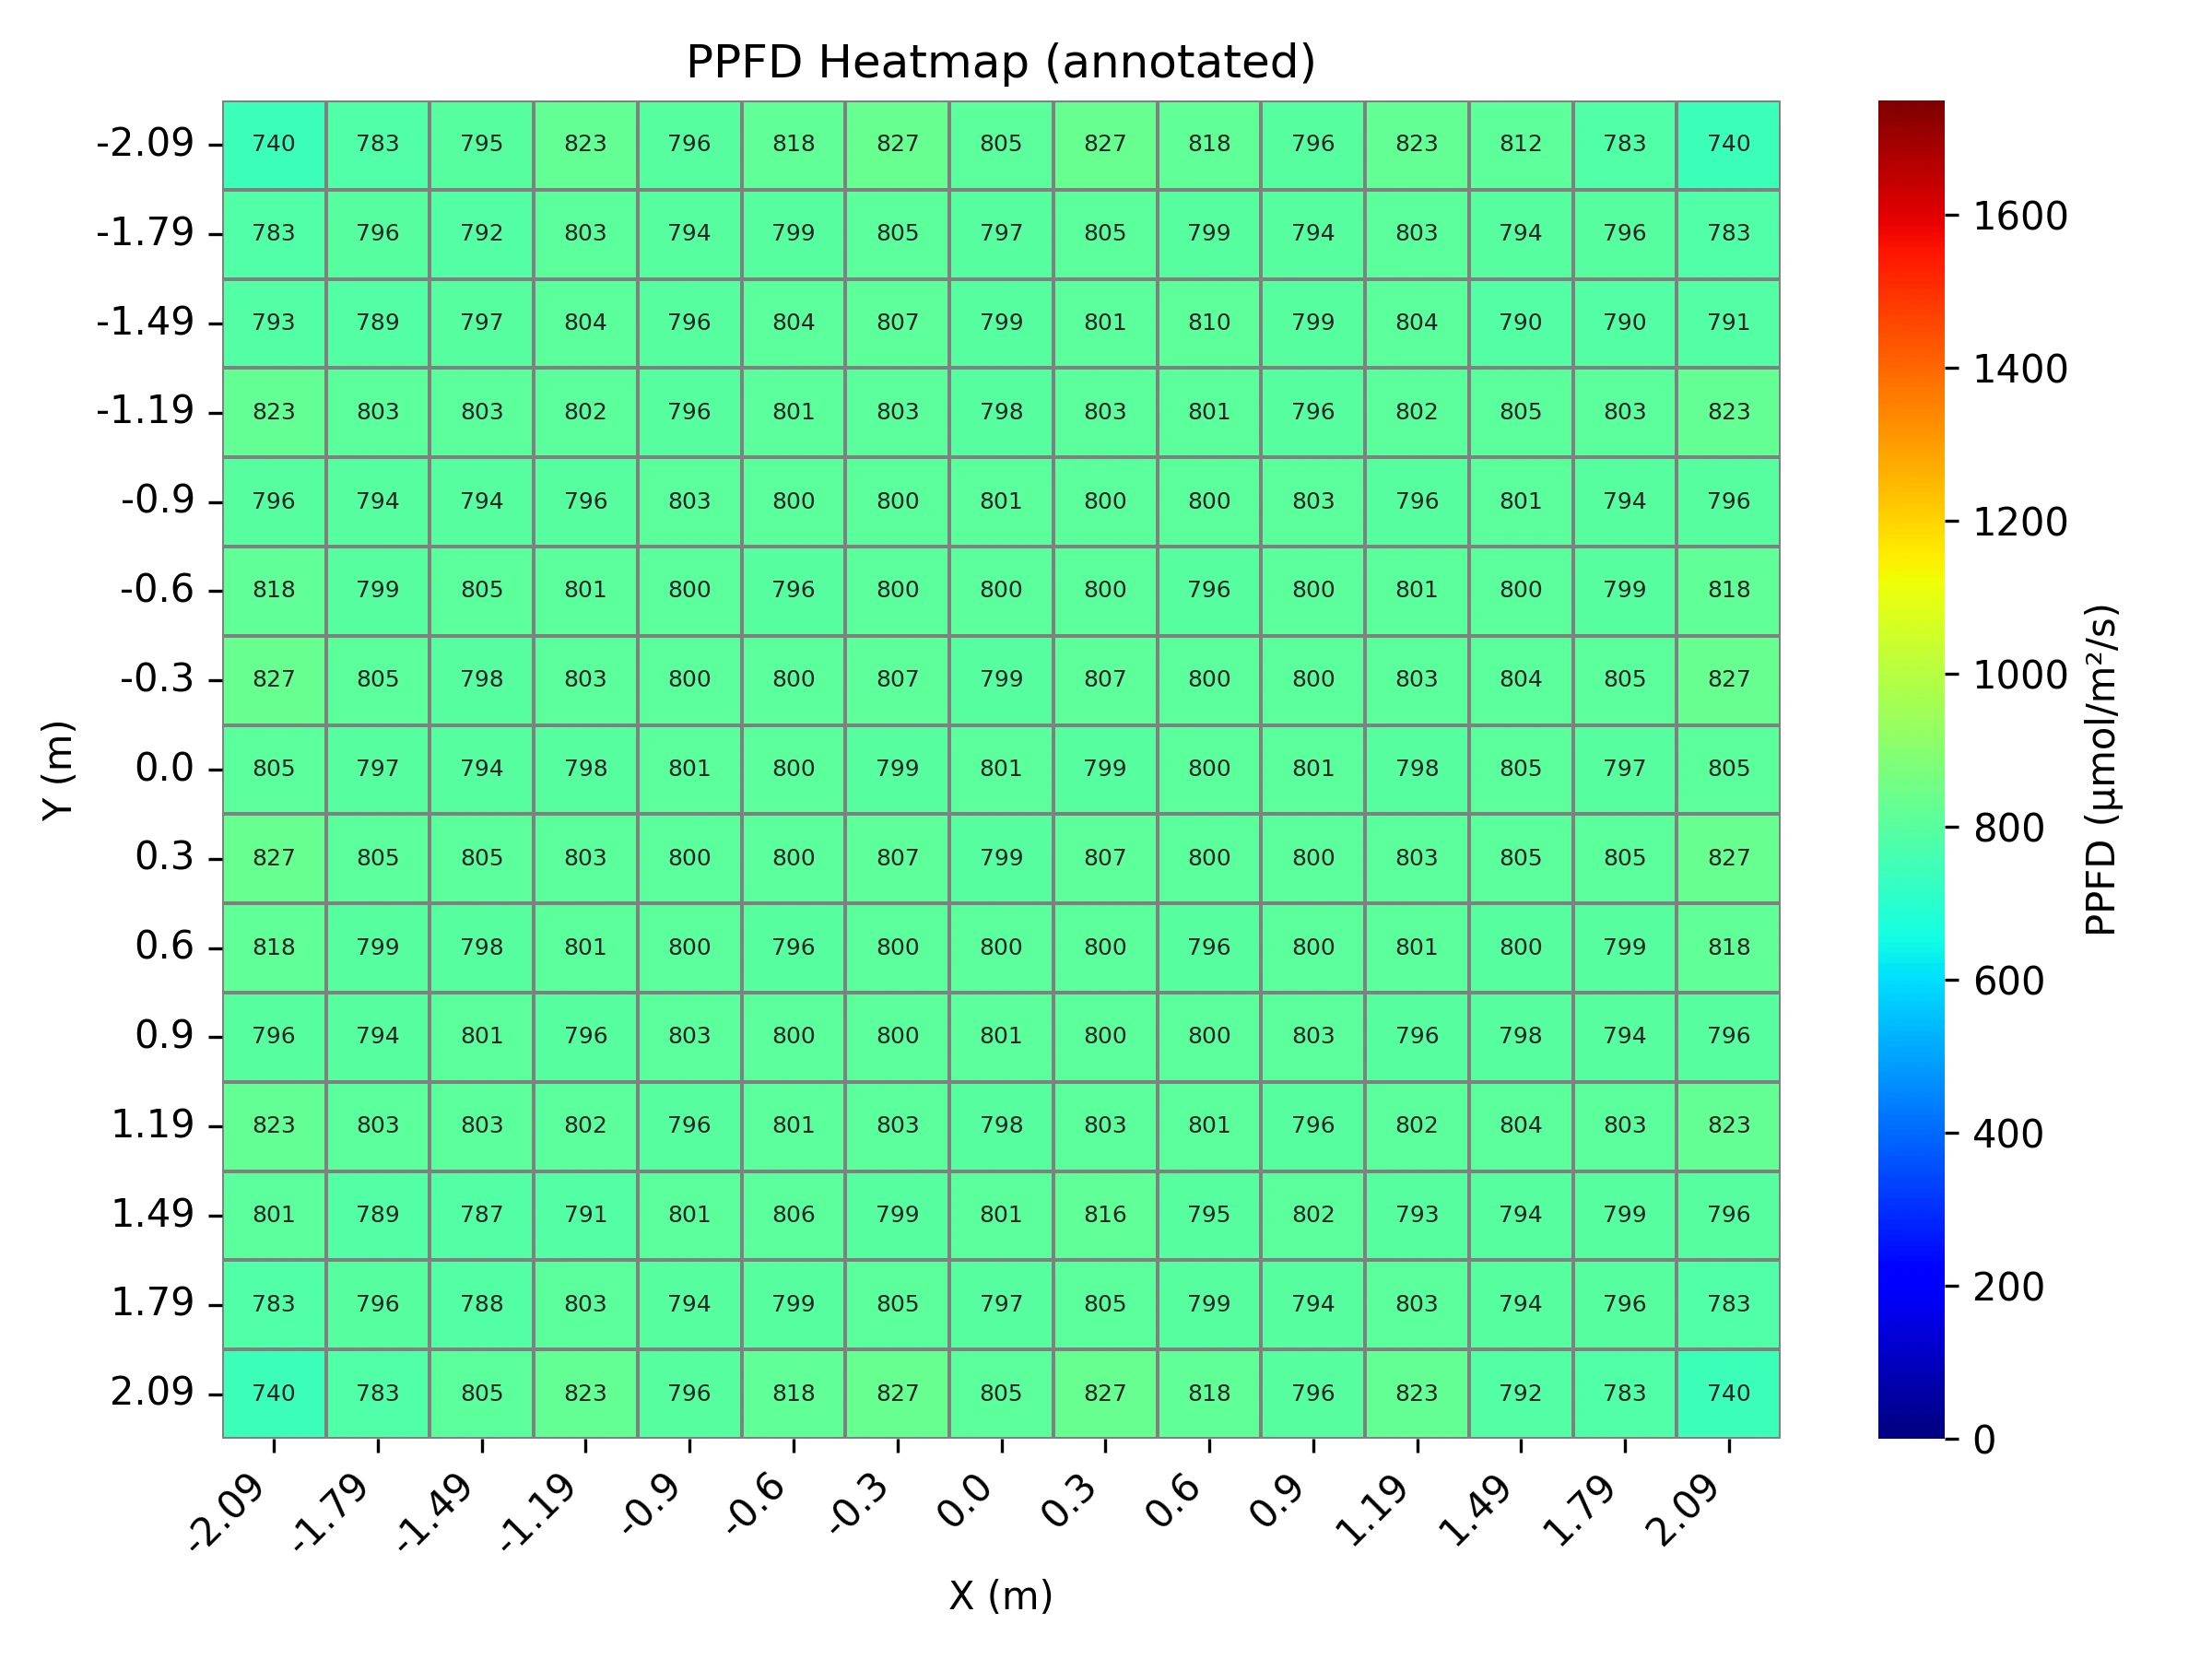
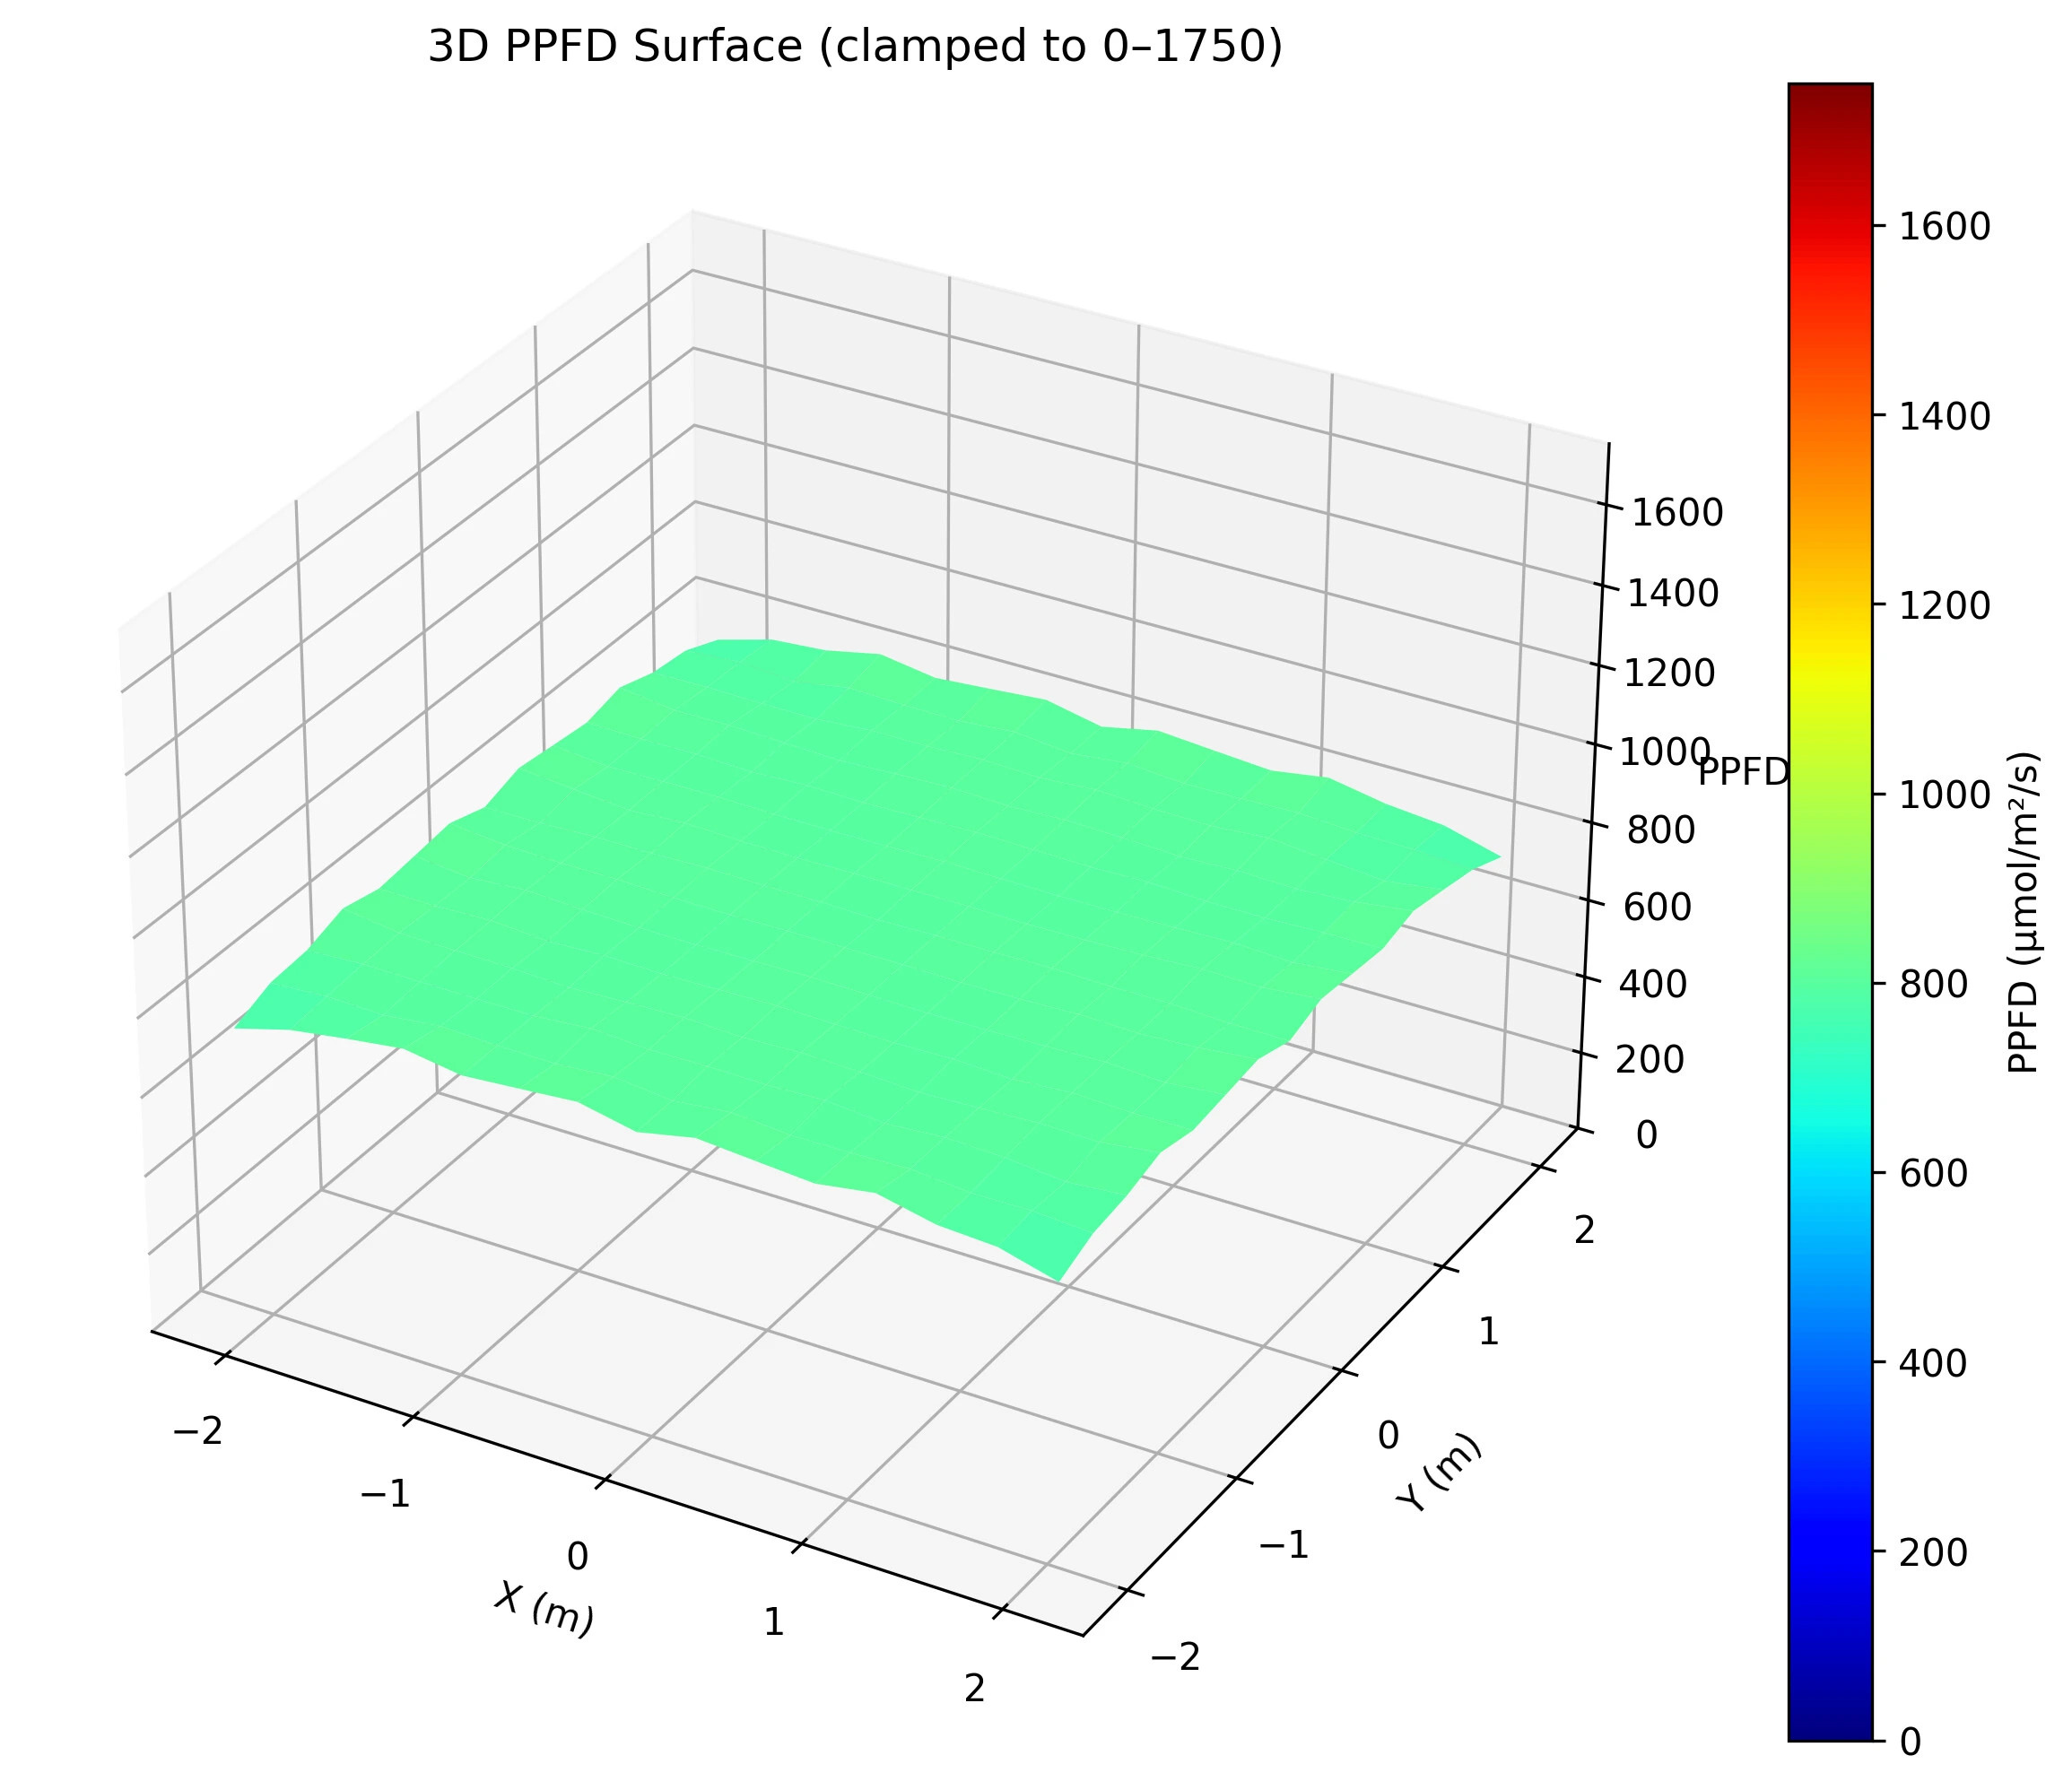
Uniformity means every point across your canopy is getting roughly the same light intensity. A non uniform setup is what most of us are used to. Very bright hotspots under the main fixture area, with weak, underlit zones around the edges and in the corners.
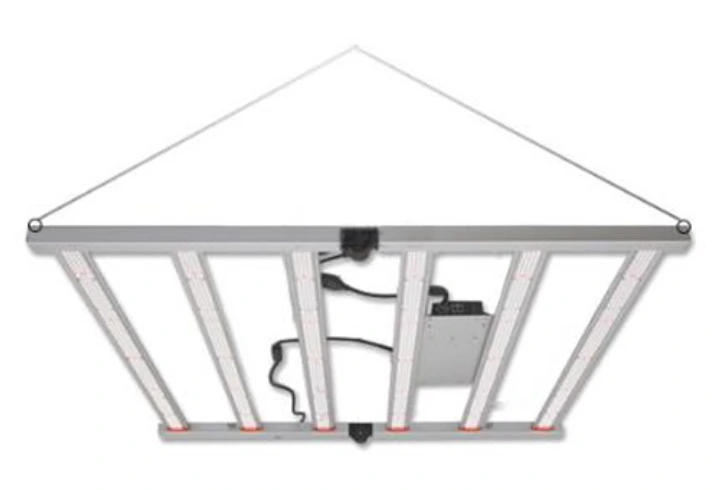
Uniformity tuning view

Spectrum

Spectrum is the mix of colors your system is putting out. You want a balanced spectrum and the ability to push that balance around as the crop moves through veg and flower. In practice that means a white based, tunable spectrum, so you can run more blue relative to red in veg, more red relative to blue in flower, and add some far red at the end of flower to push quality and finish.

Spectrum control view

What is different about what we are building?

First, it is not a bar light and it is not a flat quantum board. The physical layout is different and the control strategy is different.

This is the kind of thing you normally see on the market:

Conventional grow light

Familiar. Big fixed frames with hard-to-avoid hotspots.

Here’s a system you’ve probably never seen before:

Instead of a few long bars or a big board, we use many compact LED modules arranged in concentric square rings (for square grow spaces) and rectangular bands (for rectangular grow spaces). Each ring is its own dimming zone, so the system can shape the light field across the whole room instead of blasting everything at one fixed intensity.

Fixture CAD drawing
6x6 modular array layout

How we test this

I use the Radiance lighting simulation engine as the main tool to design and tune the layout. Radiance is a physically based engine that lets me build the exact geometry of the room and the fixture and measure PPFD at a grid of points across the canopy.

To keep this honest I also cross check the results in DIALux, since that is a common industry tool. After fixing the sensor grid so both tools sample the same points, the statistics match within about 0.1 percent. In other words, Radiance and DIALux agree on the numbers, which is what we want. Radiance is what makes it possible to simulate this non standard layout in the first place, and DIALux is a sanity check that the results line up with what a standard workflow would report.

Radiance based workflow

A look at a familiar competitor system

First, here is what a typical bar style fixture looks like in simulation.

12 × 12 ft space, bar style fixture

12×12 competitor heatmap
  • Average PPFD 940.3
  • Standard deviation 320.2
  • Degree of uniformity 65.9%
  • Coefficient of variation 34.1%

16 × 16 ft space, same bar style fixture

16×16 competitor heatmap
  • Average PPFD 1090.6
  • Standard deviation 153.1
  • Degree of uniformity 86.0%
  • Coefficient of variation 14.0%

These heatmaps show the first major problem I want to highlight: the scalability problem. With non modular grow lights you cannot always fit a “perfect” layout of fixtures into the room. The same hardware that lands at about 86 percent DOU in a 16 × 16 space drops to about 66 percent DOU in a 12 × 12 space. Same basic light, same basic technology, very different uniformity, just because the room geometry changed.

On top of that, it is hard to hit a precise target PPFD with these setups. In both of these runs the target was set to 800, but the averages drift up to around 940 and 1090 because you are forced to overdrive some areas to keep other areas from going too dim.

What happens with the modular system

With our modular system, DOU stays high even when the room size changes.

12 × 12 ft space, modular system

12×12 modular system heatmap
  • Average PPFD 801.09
  • Standard deviation 6.38
  • Coefficient of variation 0.80%
  • Degree of uniformity 99.20%

16 × 16 ft space, modular system

16×16 modular layout heatmap
  • Average PPFD 800.49
  • Standard deviation 12.12
  • Coefficient of variation 1.51%
  • Degree of uniformity 98.49%

Same target PPFD around 800. Uniformity stays in the 98 to 99 percent range, and the corners are only a few percent below the mean instead of 30 to 40 percent down.

For the data nerds

Here are the heatmaps for the simulation runs with PPFD values overlaid, plus 3D surface plots.

12 × 12 competitor heatmap annotated
12 × 12 competitor surface plot
16 × 16 competitor heatmap annotated
16 × 16 competitor surface plot
12 × 12 modular heatmap annotated
12 × 12 modular surface plot
16 × 16 modular heatmap annotated
16 × 16 modular surface plot

In the next paper we will follow up with:

  • More detailed layouts for different room sizes (including rectangles).
  • How the control system sets “target PPFD at max uniformity with minimum wattage” automatically.
  • And eventually real grow trial data once we have units in the wild.

Talk with our Principal Investigator

Level up your grow with a personal consultation. Our founder—principal investigator for our research and inventor of our product line—will help you optimize your operation and answer technical questions.

↑ Top